Dashboard Pages
|
Topics: |
Dashboard is a component of Remediation module that gives user an opportunity to view different kinds of statistical or historical information in form of diagrams, tables, graphs etc.
It consists of 2 main tabs:
- 'Administration' tab – for defining Dashboard's content
- 'Home' tab – visual representation of data defined via Administration
All users must be first authenticated in order to work with Dashboard functionality. Access to Dashboard functionality is defined through the WSO2 Identity Server.
Configuring Functionality Through WSO2 Identity Server Policies
|
Topics: |
This section describes how to configure functionality through WSO2 Identity Server policies.
Defining Remediation Menu Items Accessibility Through a Policy
In order to enable Dashboard tabs on Remediation (Dashboards, Administration), you need to import and enable component-access-remed-tabs-policy.
After enabling it you have to uncomment lines 28-29 and 72-73 within that policy so that users (those with role Data Steward or Data Supervisor) have access to 'Dashboard' ('Home') and 'Administration' tabs:
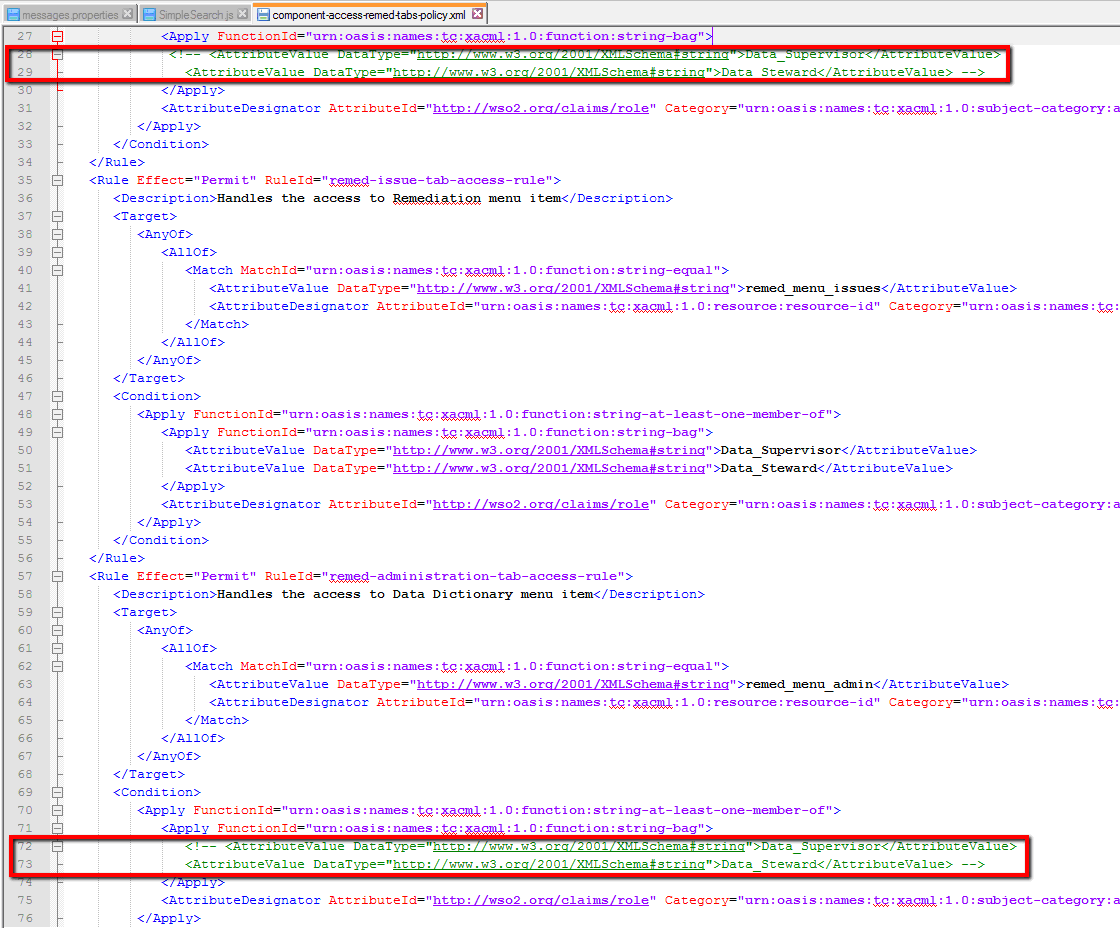
Note: Any role that is required can be defined, not only Data Stewards or Data Supervisors.
Defining Dashboard Accessibility Through a Policy
The authorize-user-dashboards-policyshould be imported and enabled for defining access to dashboards.
Since the policy defines which dashboards to be seen by which roles, please pay attention to the names of Dashboards. In the policy provided there are some dashboards defined: 'General_Dashboard', 'First', 'Second' etc. So in the UI (OPMC/IMC application) you need to create dashboards with exact same names so that users could see them, or change the names in the policy:
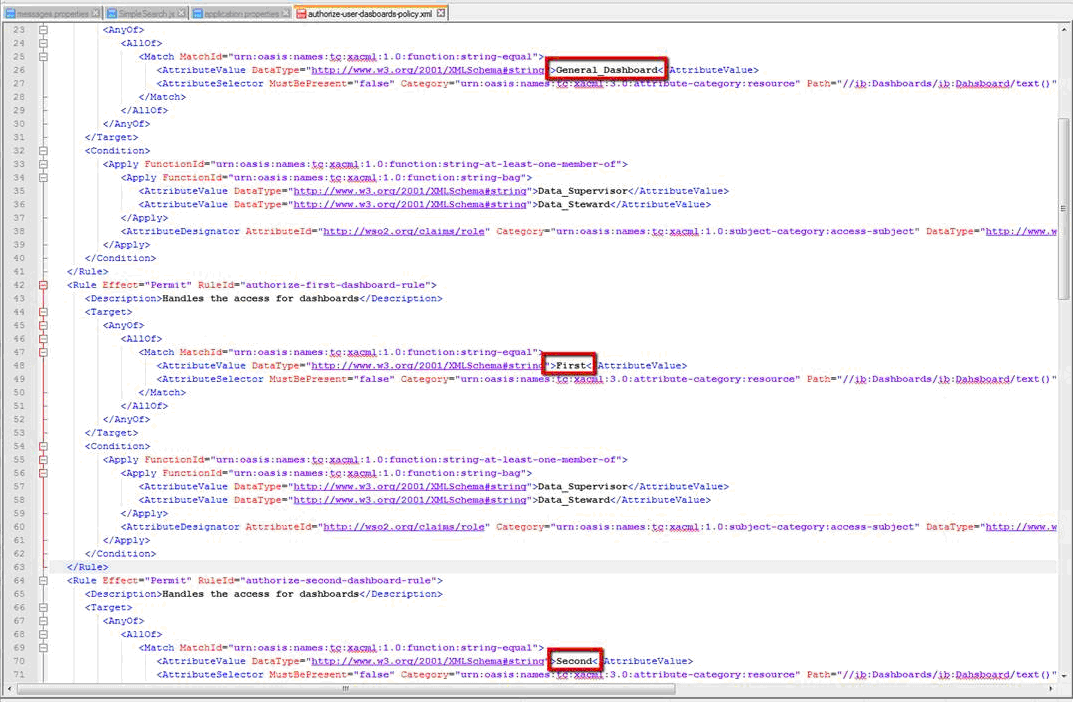
If dashboard is created in the UI but it is not defined in the policy – it will not be seen on 'Dashboard-Home' page.
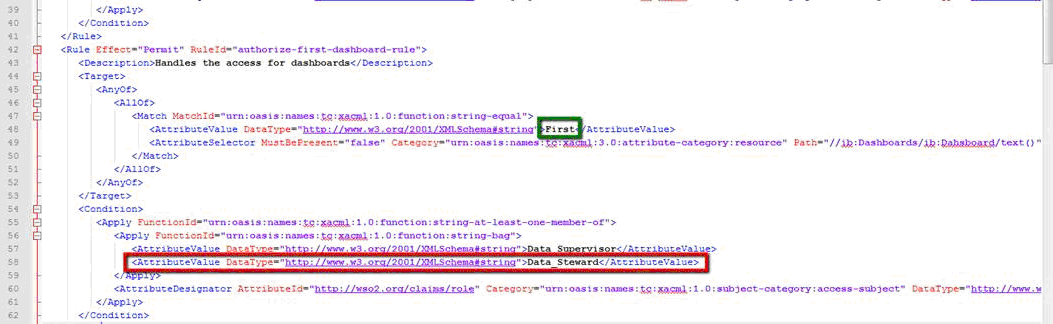
In case you need to change roles of users that can work with some dashboard – edit the appropriate lines in the policy. For example, if you want a dashboard called 'First' to be seen by Data Supervisors only, then you can delete or comment the line that provides access to this dashboard to Data Stewards:
Configuration Tasks
|
Topics: |
This section provides a set of configuration tasks to help you configure OPMC Remediation.
Configuring Through the Application User Interface
|
Topics: |
This section describes how to configure OPMC Remediation through the application user interface.
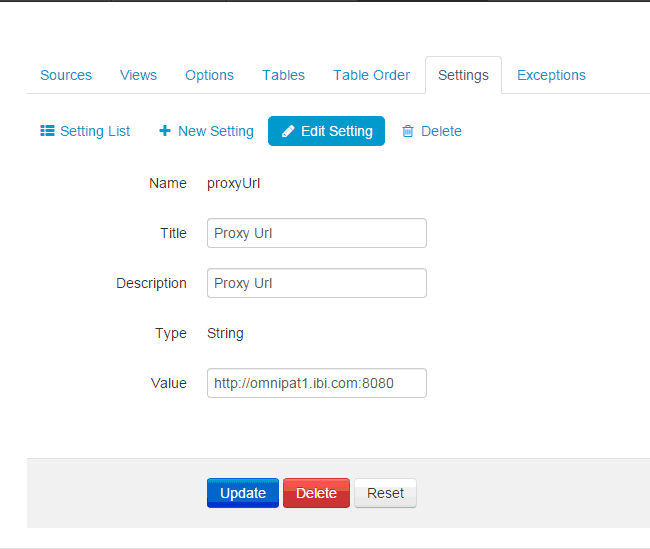
Configuring a Proxy URL
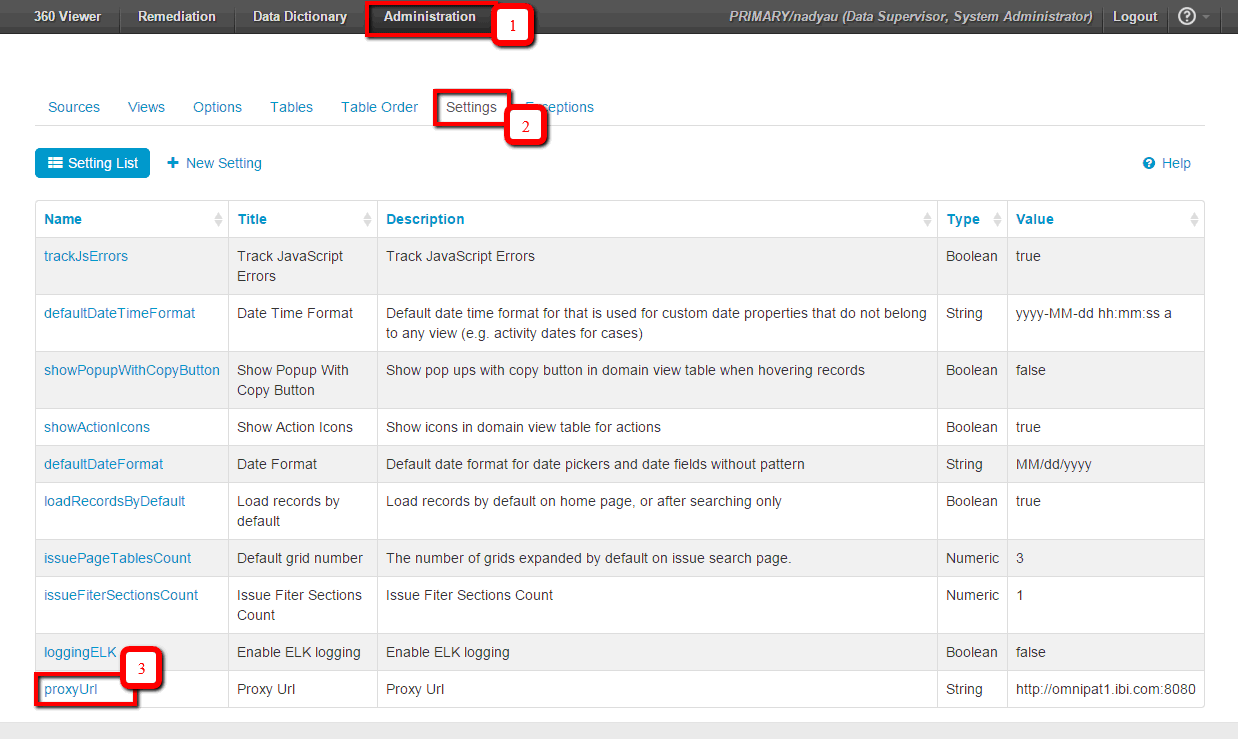
Proxy URL is used to define where external panels will be taken from. To set up that URL user should log in xMC application, navigate to Administration (1) -> Settings (2) -> select 'Proxy URL' setting (3):
After clicking Edit Setting, a user can enter the required parameters.
Creating a Panel Using the Administration Tab
After policies are imported and enabled and Proxy URL is set up you can work with Remediation dashboard functionality in the xMC application.
First of all you need to create Panels that can be displayed on the Dashboard. Navigate to Remediation (1) -> Administration (2) -> Panels tab (3) and click 'New Panel' label (4):
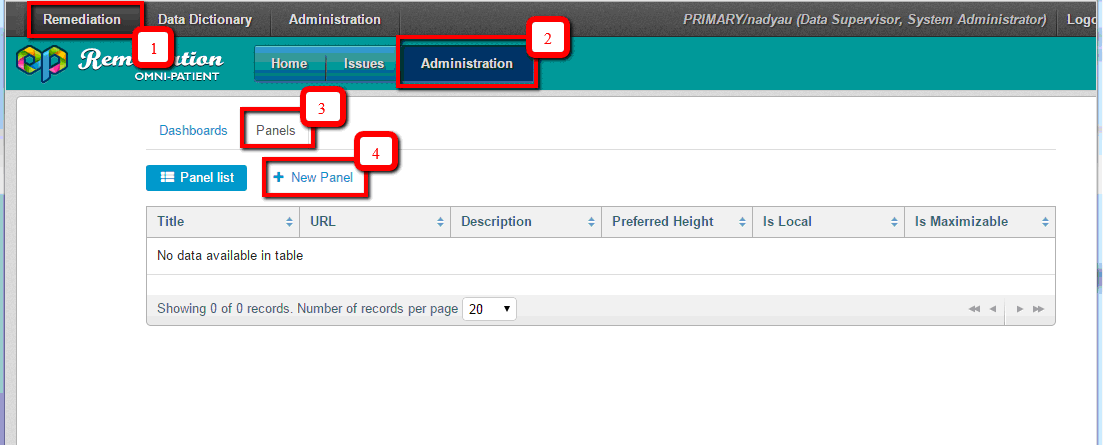
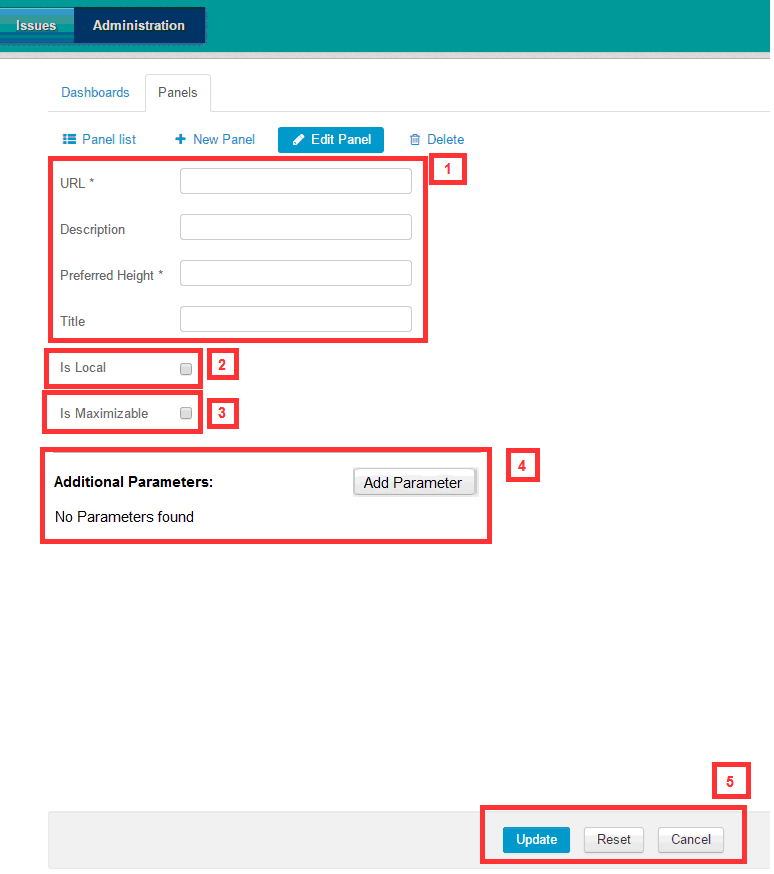
You will be navigated to the 'New Panel' page, the structure of which is the following:
- Input fields where you identify needed parameters.
- URL – URL to Panel (mandatory field). Right now we use the following URL (they may differ from the ones you are using):
- dashboard/activityStream - local URL
- /dashboard/activityToday - local URL
- /ibi_apps/WFServlet?IBIAPP_app=remediationreports&IBIF_ex=allopenticketspiechart-1.fex – WebFOCUS URL
- /ibi_apps/WFServlet?&IBIF_ex=workload_report – WebFOCUS URL
- /ibi_apps/WFServlet?&IBIF_ex=alltransitionspiechart – WebFOCUS URL
- Description – description of panel's content (non-mandatory field)
- Preferred height – desired height of panel. If you leave it as 0 – the height of panel will be calculated depending on its content
- Title – name of a panel that will be displayed on the Dashboard and in the list of panels
- 'Is Local' check box – for identifying whether the URL is internal
(within the application) or from WebFOCUS.
Note: It is important to select the check box for internal URLs and not to select them for external (WebFOCUS) types.
- 'Is maximizable' check box – for defining whether panel can be maximized on the Dashboard
- 'Additional parameters' section – for setting up any needed additional parameters for a panel. They will be described below.
- Buttons for creating, resetting content or cancelling creation of a panel
- URL – URL to Panel (mandatory field). Right now we use the following URL (they may differ from the ones you are using):
- dashboard/activityStream - local URL
- /dashboard/activityToday - local URL
- /ibi_apps/WFServlet?IBIAPP_app=remediationreports&IBIF_ex=allopenticketspiechart-1.fex – WebFOCUS URL
- /ibi_apps/WFServlet?&IBIF_ex=workload_report – WebFOCUS URL
- /ibi_apps/WFServlet?&IBIF_ex=alltransitionspiechart – WebFOCUS URL
- Description – description of panel's content (non-mandatory field)
- Preferred height – desired height of panel. If you leave it as 0 – the height of panel will be calculated depending on its content
- Title – name of a panel that will be displayed on the Dashboard and in the list of panels
By default 'Additional Parameters' section is empty, but Administrator can easily create them if needed by clicking 'Add Parameter' button. Once the button is clicked – fields for new parameter will appear.
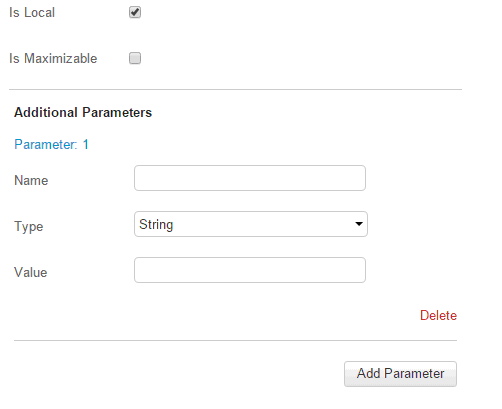
Note: Any number of parameters can be added for a panel by clicking Add Parameter.
'Name' field should be unique.
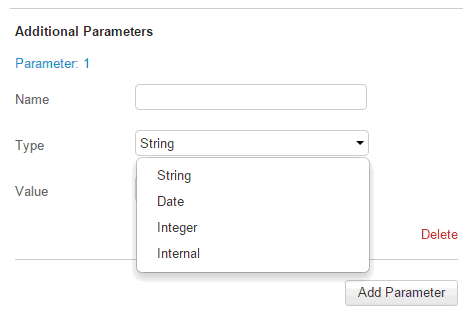
'Type' field is a drop down field that contains four items for now: Integer, Internal, String and Date. Depending on what type of parameter is selected – the 'Value' field will expect appropriate input. For example, if user selects 'Integer' type – only numeric values could be saved in 'Value' field.
'Value' field is for defining what data to be included in the request.
Quite interesting is 'Internal' type of a parameter. If user selects it, 'Value' field becomes a drop down with predefined items:
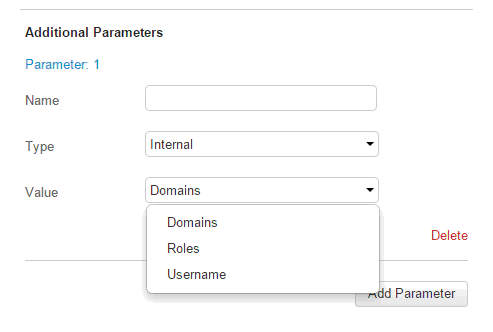
For example, if "Roles" item is selected, then all roles, which current user has, will be included into request.
In case parameter is not needed- it can be deleted by clicking 'Delete' label.
After Panel is created it appears in the list of Panels, can be edited, deleted or used in any Dashboard.
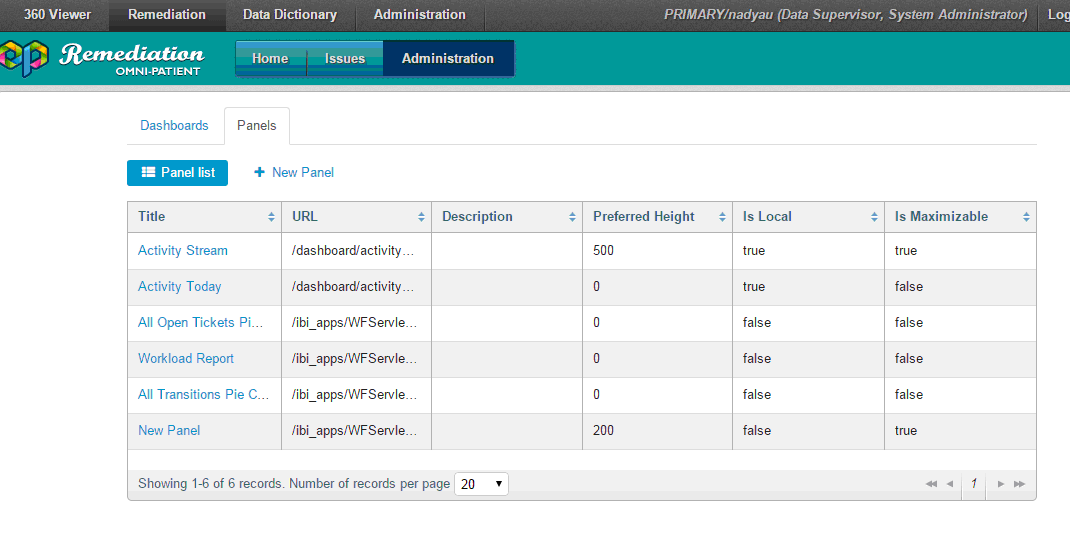
Note: Panels can be sorted in the grid by clicking on any column header.
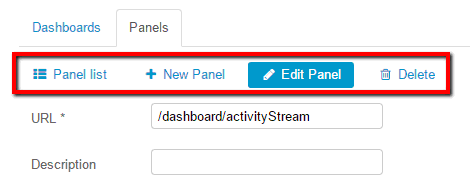
Editing or Deleting a Panel Using the Administration Tab
In order to edit any panel user should select any Panel's title from the Panel list. 'Edit Panel' page will be displayed:
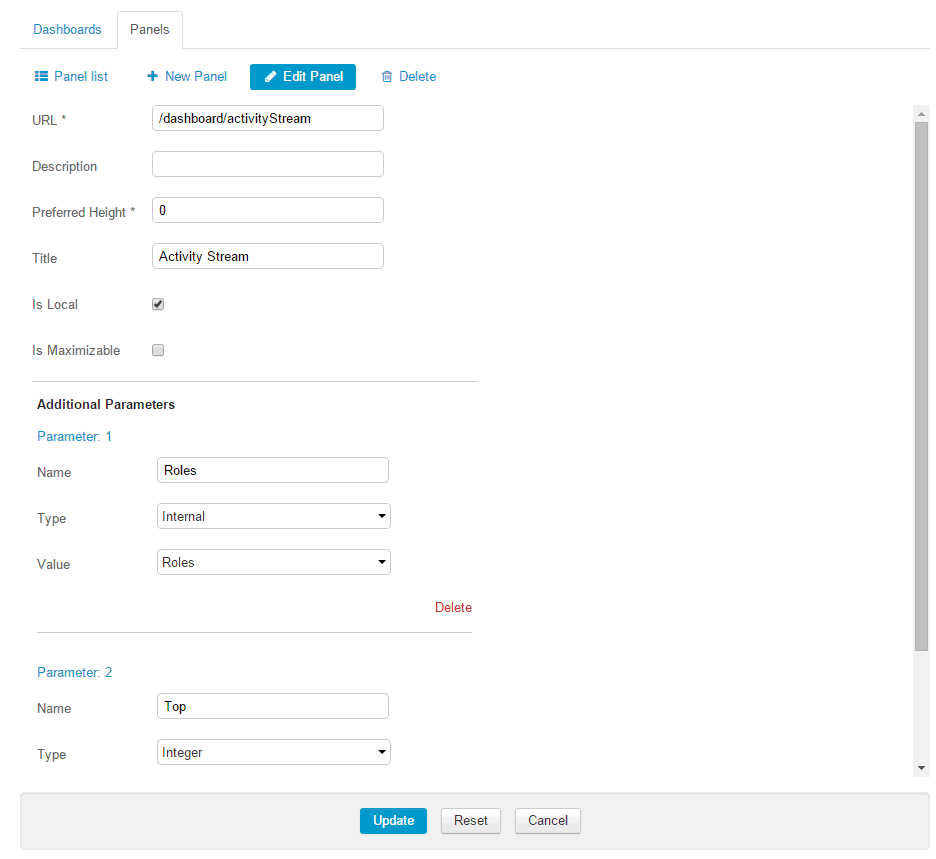
The structure of the page is similar to 'New panel' page. The difference is that values are already set in the fields by default, and can be changed if needed.
Also user can navigate to 'Panel list', 'New Panel' pages from this page, or delete selected panel using 'Delete' label:
Note: A confirmation dialog will be displayed when deleting a panel or navigating away from the page when there are any unsaved changes.
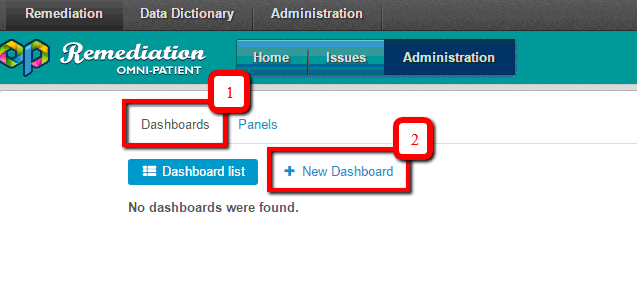
Creating a Dashboard Using the Administration Tab
After required panels are configured you should create a dashboard with them, so that you can view the data for each panel.
Note: The names of dashboards must coincide with the names defined in authorize-user-dashboards-policy, so that they can be viewed in the user interface.
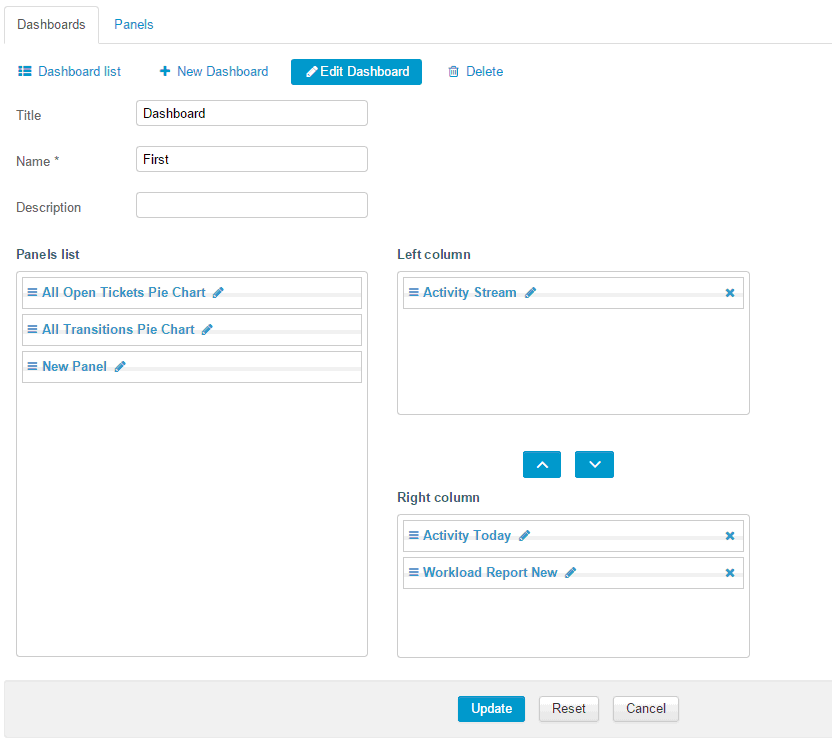
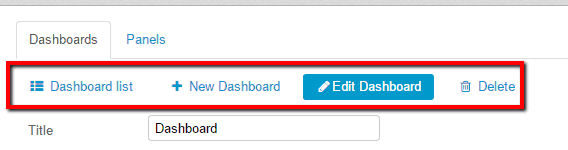
In order to create a dashboard navigate to Dashboards tab (1) in Remediation Administration -> click 'New Dashboard' label (2):
After that you will be navigated to 'New Dashboard page' with the following structure:
- Input fields for specifying required information about the
dashboard:
- Title – data entered here will be displayed on Dashboard (Home) page and in Dashboard list (non-mandatory field)
- Name – unique identifier of the dashboard. Names should be the same as ones defined in the policy (mandatory field)
- Description – description of dashboard's content (non-mandatory field)
- 'Panels list' box – contains all created panels
- 'Left column' and 'Right column' boxes – for defining which
panels to be displayed in the dashboard, in which column and in
which order
Note: A dashboard can be created without containing any panels.
- Buttons for creating, resetting content or cancelling creation of a dashboard
- Title – data entered here will be displayed on Dashboard (Home) page and in Dashboard list (non-mandatory field)
- Name – unique identifier of the dashboard. Names should be the same as ones defined in the policy (mandatory field)
- Description – description of dashboard's content (non-mandatory field)
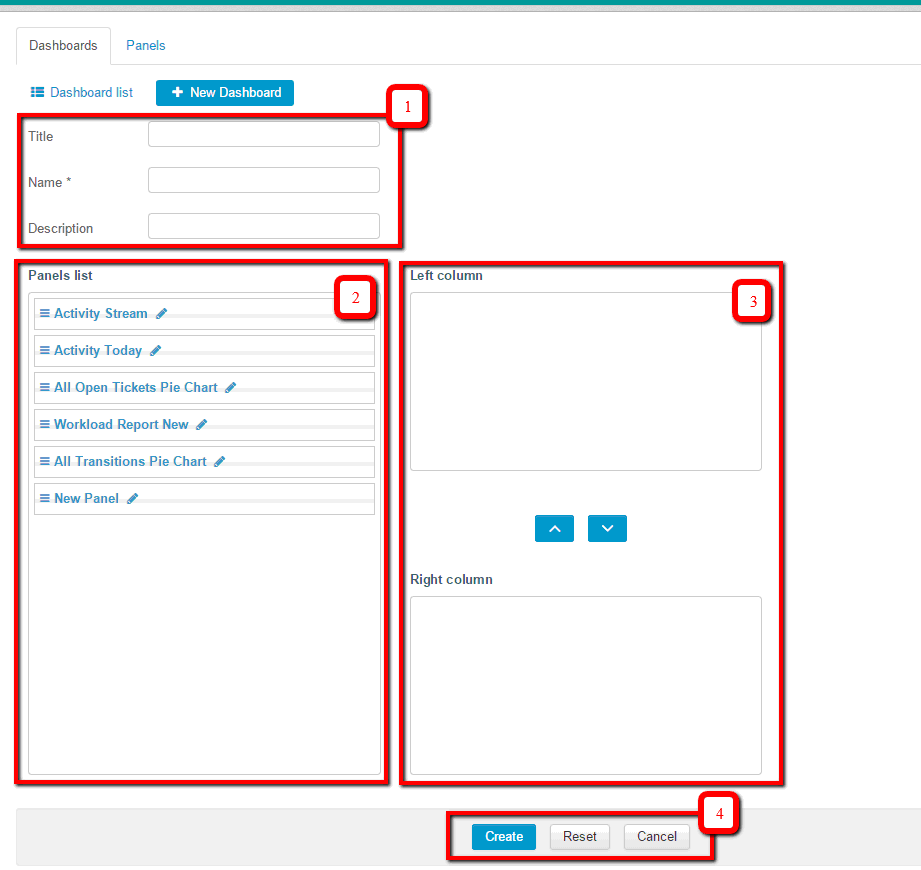
In order to set some panel in the left or right column, user should drag needed panel from Panel list box and drop in Left/Right column box. Panel can be only in one box at a time. If a user wants to delete a panel from the Left/Right column, the user should click the corresponding 'X' icon and the panel will go back to the 'Panel list' box.
After dashboard(s) are created they can be viewed, sorted, edited or deleted.
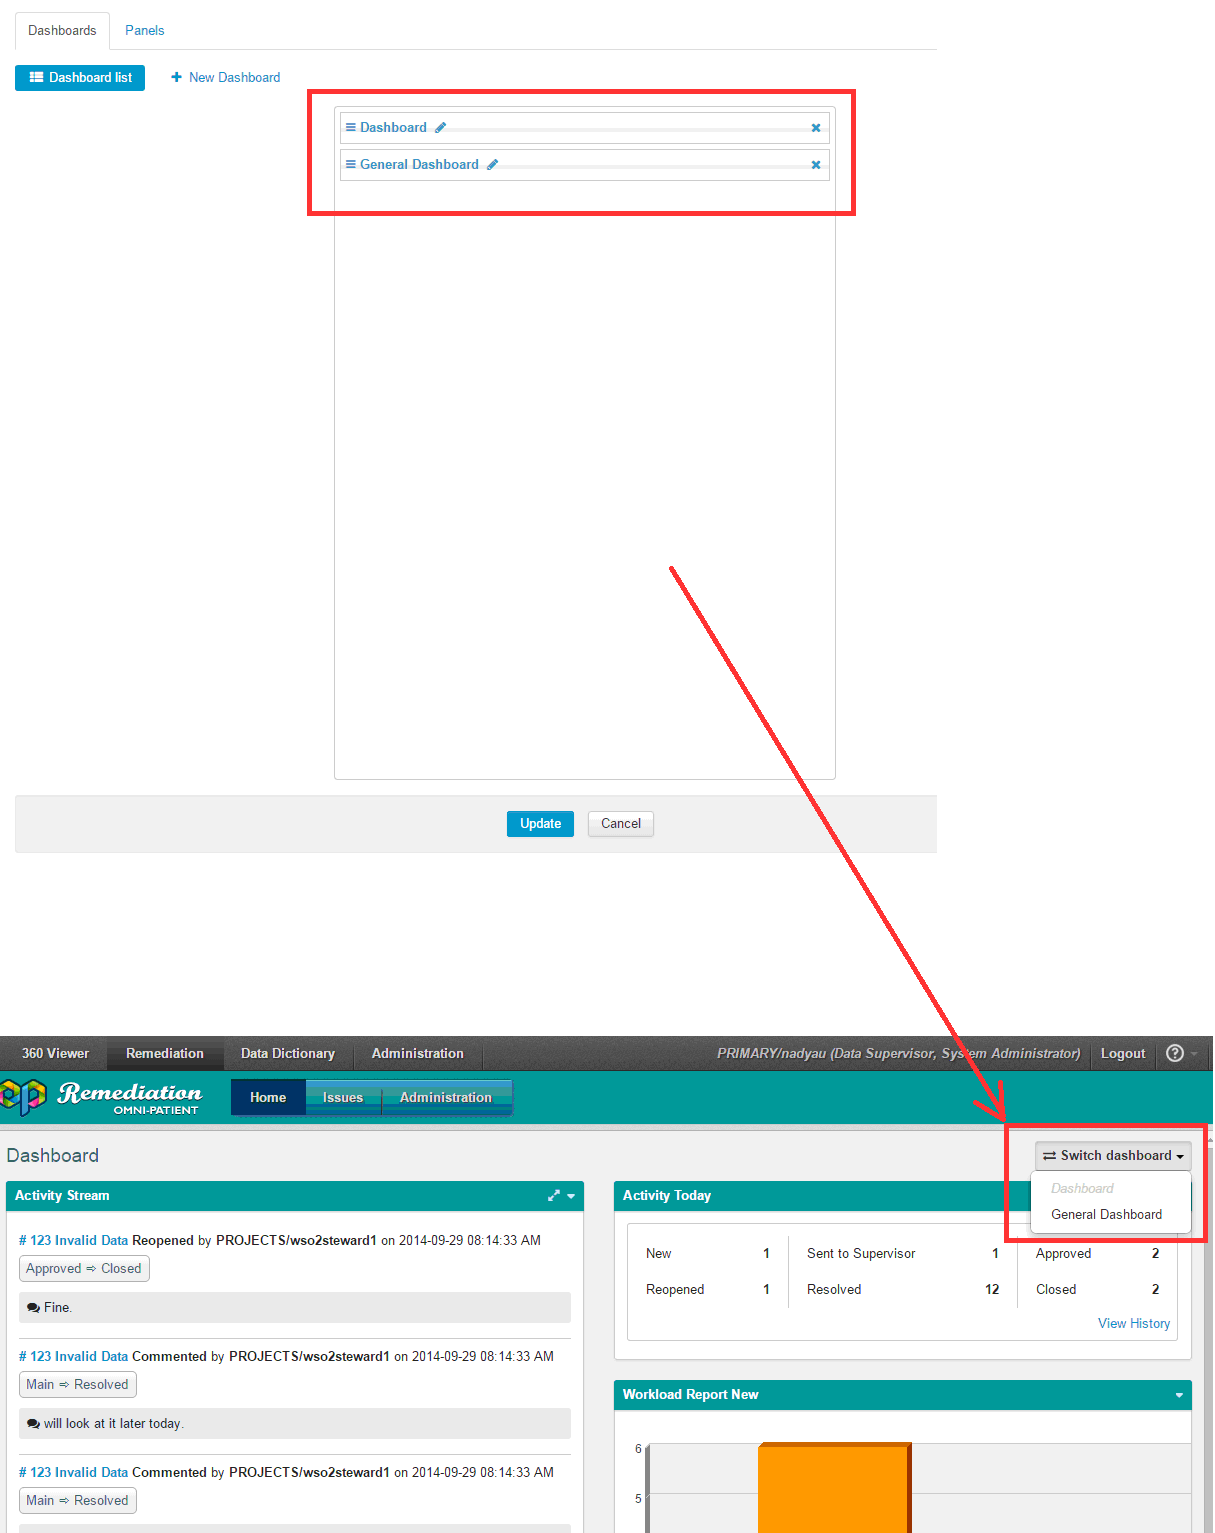
Note: The order of the dashboards on the Dashboards list page defines the order of dashboards that are displayed in the Switch dashboard drop-down list.
Editing or Deleting a Dashboard
In order to edit already created dashboard user should click on Pencil icon for needed dashboard on 'Dashboard list' page:
Once Pencil icon is clicked user is navigated to 'Edit Dashboard' page. The structure of the page is similar to 'New Dashboard' page. The difference is that parameters are already set on the form, but can be changed as desired:
Also user can navigate to 'Dashboard list', 'New Dashboard' pages from this page, or delete selected Dashboard using 'Delete' label:
Note: A confirmation dialog will be displayed when deleting a panel or navigating outside the page when there are any unsaved changes.
Another way of deleting dashboards is using 'X' icons on the 'Dashboard list' page:
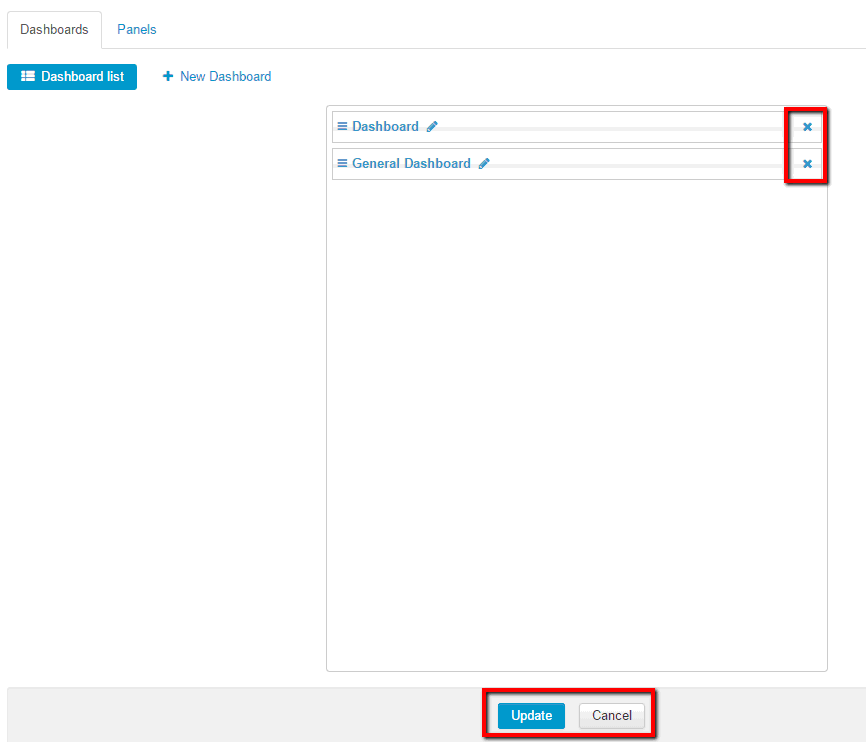
After needed dashboards are deleted with 'X' icon – 'Update' button should be clicked, so that changes were applied, or 'Cancel' button – if user wants to discard changes and leave dashboards as they were before.
Note: When changing the order of dashboards, click Update so that changes could be applied. Notification about applied changes will be displayed in the upper-right corner.
Viewing Dashboards
|
Topics: |
After dashboard(s) are created in Administration module they can be viewed on Dashboard ('Home') page by clicking 'Home' tab:
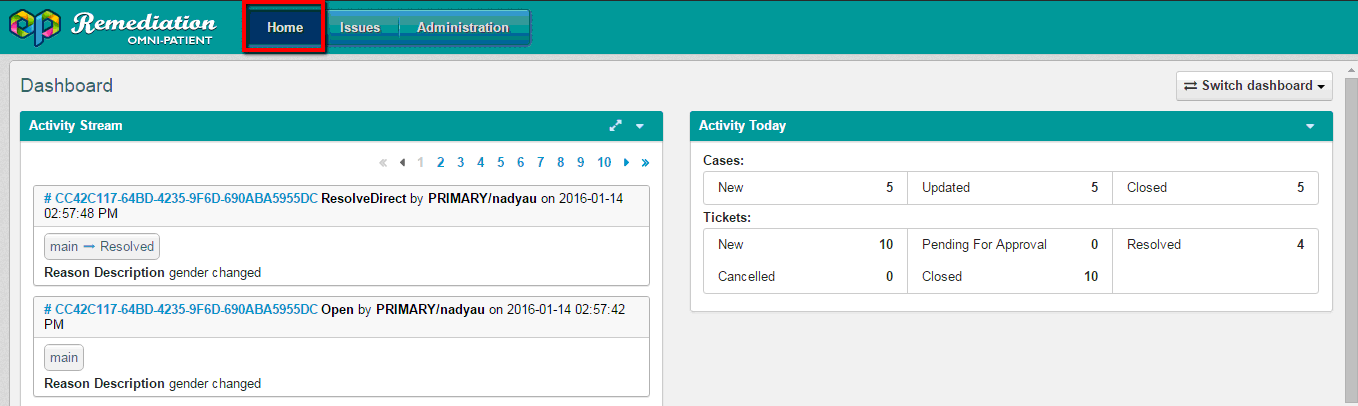
The structure is the following:
- Title of the dashboard currently displayed
- 'Switch dashboard' drop down
- Panels defined via Administration module
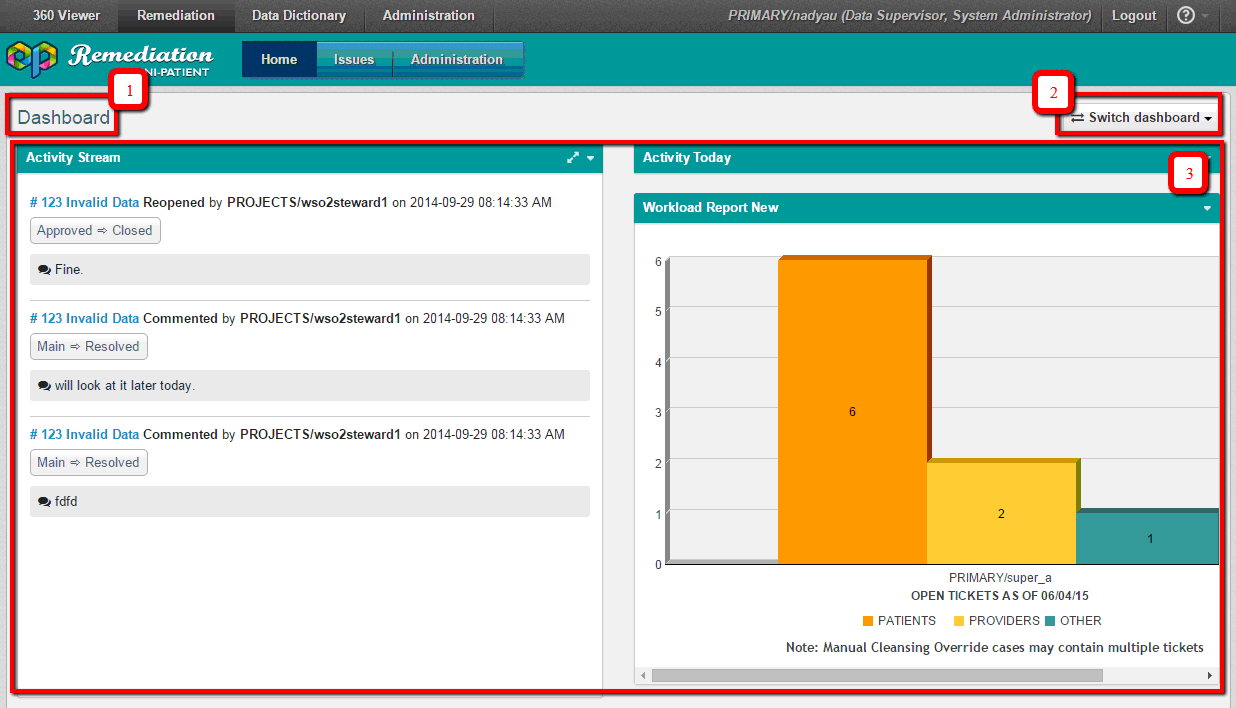
The order and display of panels depends on settings defined in Administration module.
All panels have drop down icon displayed for them with 'Refresh' and 'Collapse' items:
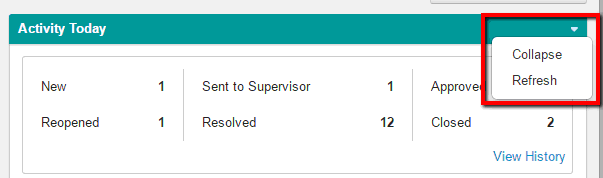
'Refresh' item reloads panel and displays the newest data available.
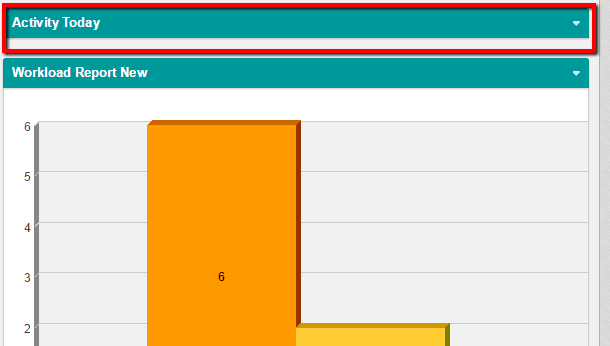
'Collapse' item hides the panel's content, leaving only its header displayed:
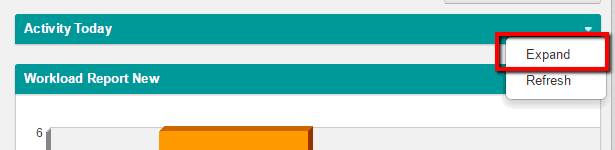
To view panels' data again user should select 'Expand' item from the drop down:
Panels that have the Is Maximizable check box selected have the Maximize icon displayed, as shown in the following image.
If a user clicks on the icon, only the selected panel is displayed on the page. To return to the default view with all panels displayed, the user should click the Restore icon, as shown in the following image.
If a user has access to more than one dashboard and wants to view a different dashboard from the default selection, the user can select the required dashboard from the 'Switch dashboard' drop-down list, as shown in the following image.
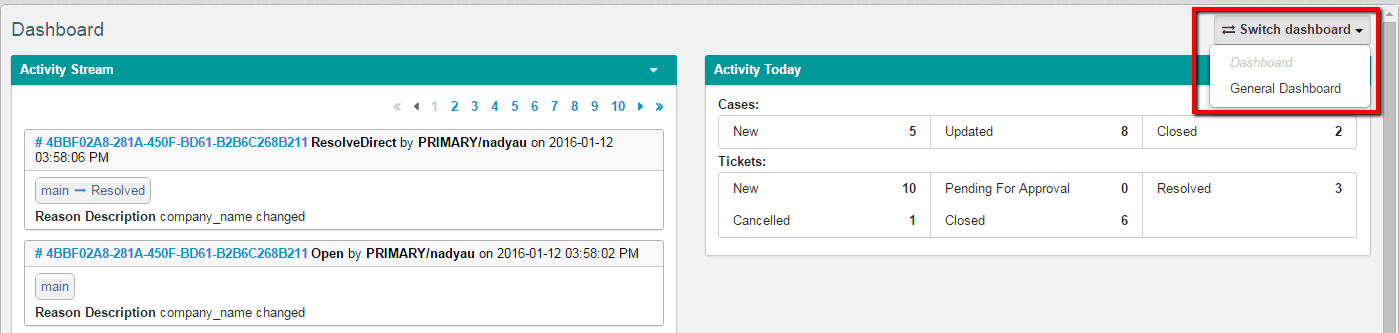
Note: The dashboard that is currently displayed is greyed out and cannot be selected.
Types of Panels
There are two types of panels that are displayed on Dashboard page:
- Internal – those that are general inside the application (they need to have 'Is Local' parameter set to 'True' in Administration);
- External – those that are general by WebFOCUS (they need to have 'Is Local' parameter to be set to 'False' in Administration)
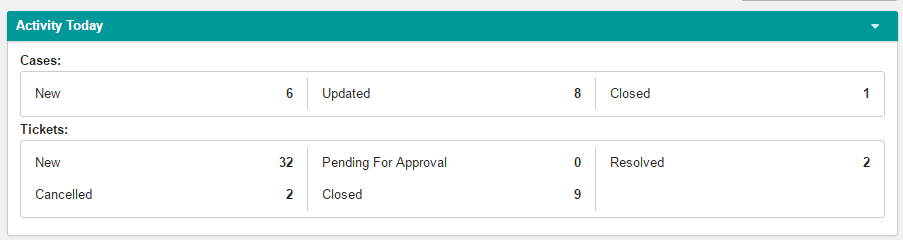
As the default, OPMC Remediation is shipped with two internal panels displayed on the Home (Dashboard) page: Activity Stream and Activity Today.
In the Activity Stream, all transitions, reassignments, comments for all cases in the system are displayed:
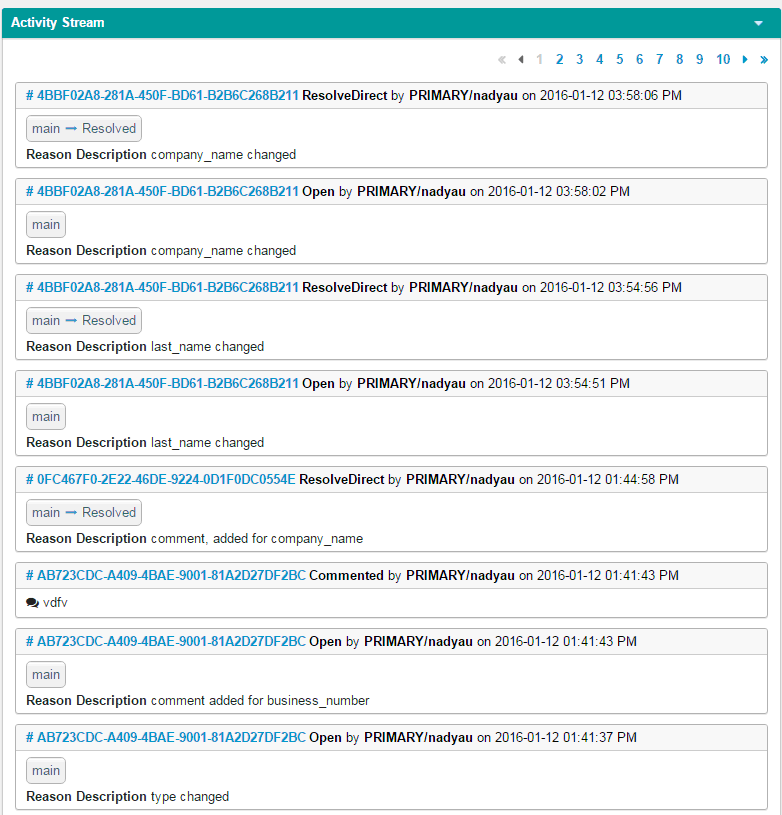
All activities are sorted by time: most recent first. For each event, the issue ID and description, who initiated the event, when initiated, and any comments, are displayed. The user may go directly to the Issue page by clicking on a hyperlinked Issue name and ID.
Activity Today displays a summary of all daily events and issues to which the user has access.
Note: Only the activities of domains to which a user has access are displayed in the panels.