Monitoring Data Processing
The Processing section enables you to monitor the data processing that is occurring in the system. You can observe the overall status and any relevant error messages in a unified view. This view can be sorted by columns to provide easy navigation. You can also enable filters to customize the view.
In the left pane of the Omni Console, click Processing, as shown in the following image.
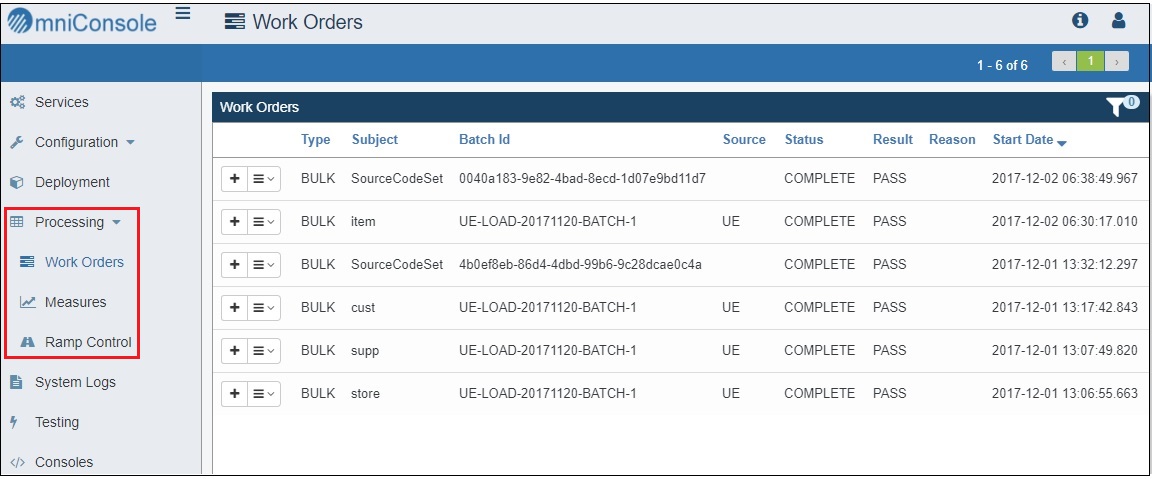
The Processing pane is organized into the following views, which you can select from the left pane:
- Work Orders
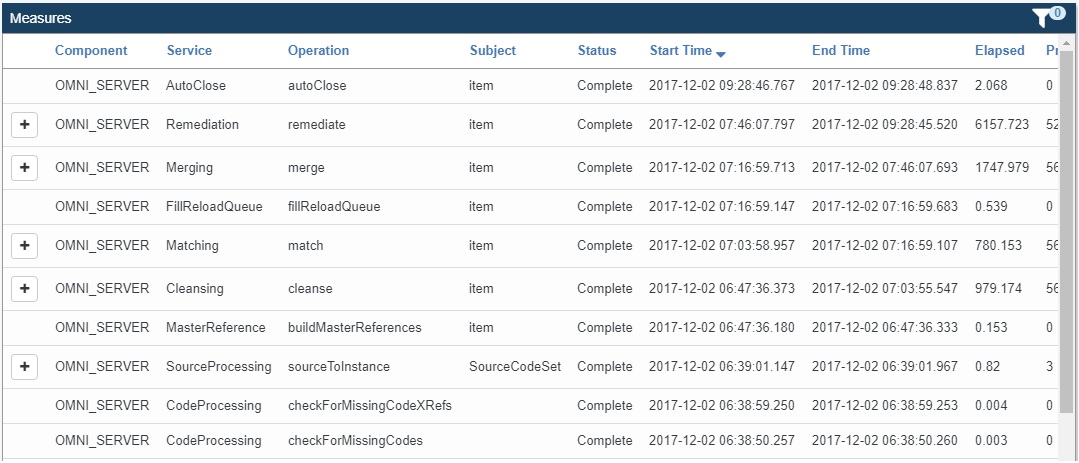
- Measures
- Ramp Control
The default view is set to Work Orders, as active work orders are usually of most interest in production environments, as shown in the following image.
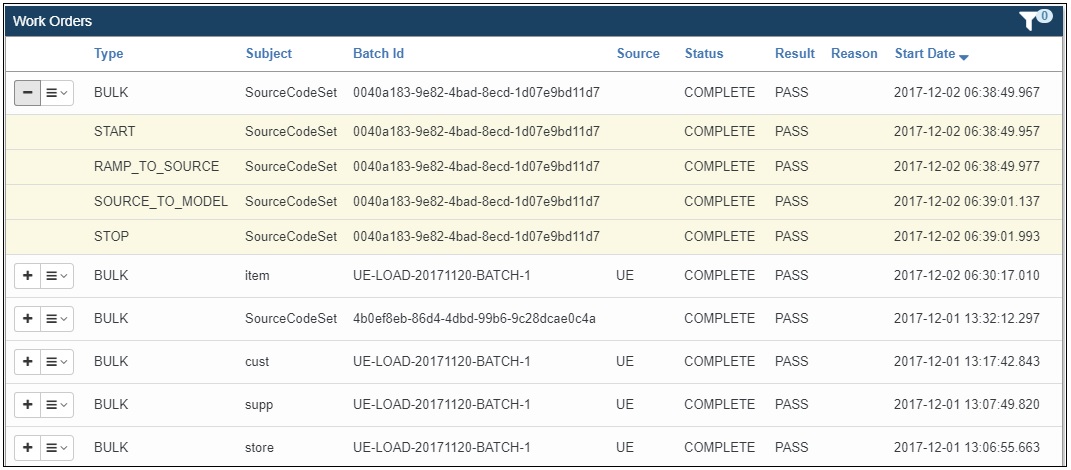
You can expand the information on any given entry by clicking on the plus (+) icon and view further details.
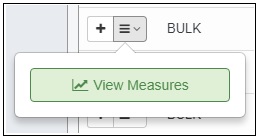
The drop-down menu next to a specific entry enables you to view the measures (statistics) as well as logs for the given process. The measures and logs can be also accessed through the left pane, but this provides a pre-filtered approach.
The measures enable you to see details on what actions have occurred during the process, the number of processed records, its duration and enables further drill-down capabilities into detailed processing and its statistics. This allows for identification of bottlenecks and their resolution.