Subject Profile
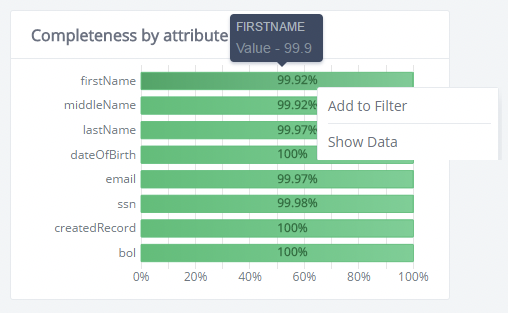
The Subject Completeness bar chart displays the percentage of Subject data completeness.
Total records, Populated records, Blank records, and Blank attributes tiles display the number of records corresponding to the name of the tile (Blank/Populated, and so on).
The Completeness by attribute bar chart displays the percentage of completeness for each attribute. It shows you a visual representation of the subject you are working with and helps identify where the possible data problem might be.
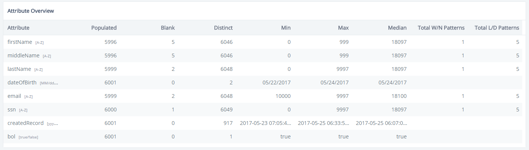
The Attribute Overview table displays attribute data characteristics from the following categories:
Populated, Blank, Distinct, Min, Max, Total Word/Number Patterns and Total Letter/Digit Patters.