Navigating the Omni-Gen™ Personal Edition User Interface
|
Topics: |
This section identifies and describes key areas of the Omni-Gen™ Personal Edition user interface.
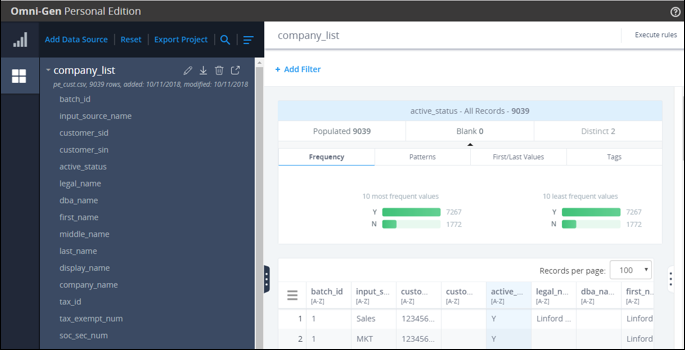
The following image shows the layout of the Omni-Gen™ Personal Edition user interface when a data source is loaded.
In this example, a comma-separated values (CSV) file named pe_cust.csv has been loaded into Omni-Gen™ Personal Edition.
Title Bar
The Title bar displays the product title on the left and provides a link to additional resources (About) on the right, as shown in the following image.

View Mode
Clicking the Profiling or Data Grid icon in the left pane changes how your imported data is viewed and presented in Omni-Gen™ Personal Edition. The Profiling and Data Grid icons are shown in the following image.
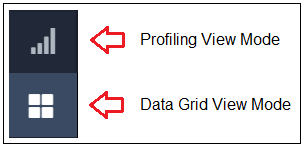
The Profiling view mode provides a data profile of your imported data that is currently selected. This view includes metrics that show the current state of the data (for example, subject completeness and completeness by attribute).
The Data Grid view mode provides an actual view of your imported data that is currently selected (as records on a page). Using this view, you can quickly see the relationship of one attribute in your data to the other attributes in the grid. The Data Grid view enables you to create Data Quality Rules and run experiments on the data.
Menu Bar
The menu bar, shown in the following image, provides a set of high-level options that enable you to quickly manage your data in Omni-Gen™ Personal Edition.

The set of options, from left to right, includes:
- Add Data Source. Adds (imports) a new data source into Omni-Gen™ Personal Edition. You can add multiple data sources and toggle between them for analysis.
- Reset. Removes all imported data sources from Omni-Gen™ Personal Edition.
- Export Project. Exports the current project from Omni-Gen™ Personal Edition for use in Omni-Gen™ Master Data and Data Quality Editions.
- Search. Searches across all of the data sources that have been imported into Omni-Gen™ Personal Edition.
- Sort Data. Sorts the available data sources in Omni-Gen™ Personal Edition.
Loaded Data Summary View
Shown in the left pane, the Loaded Data Summary View provides a summary of the imported data that is currently selected in Omni-Gen™ Personal Edition, as shown in the following image.
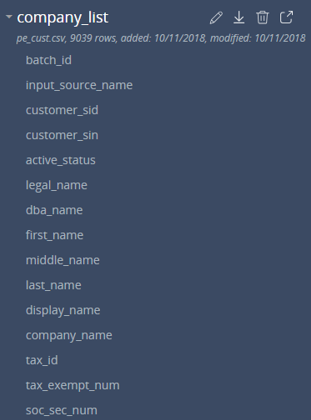
In this example (company_list, which is the header/title), a CSV file named pe_cust.csv has been imported. This CSV file, which contains 9039 rows was added on 10/11/2018 and also modified on 10/11/2018. The list of individual values (for example, batch_id, input_source_name, customer_sid, and so on) represent the attributes in this imported data. You can select each attribute to view information (for example, a data profile) about that attribute on a more granular level.
The Loaded Data Summary View also provides a set of options that you can apply to the data that is currently selected, as shown in the following image.

The set of options, from left to right, includes:
- Rename. Renames a data source in the system.
- Reload. Reloads a data source. This removes the existing data and reloads it from the same source.
- Delete. Deletes the selected data source from Omni-Gen™ Personal Edition.
- Export. Exports the selected data source into a selected format (CSV, Excel, or database table).
Workspace Header
The Workspace Header, shown in the following image, provides the name of the data source currently selected (for example, company_list) and the Execute rules button, which allows you to apply any of the defined data quality rules you have selected against your data source.

Filter Bar
The Filter bar, shown in the following image, enables you to specify and set a variety of filters to narrow the focus of your data and provide a subset of your data that you can analyze.

Workspace Area
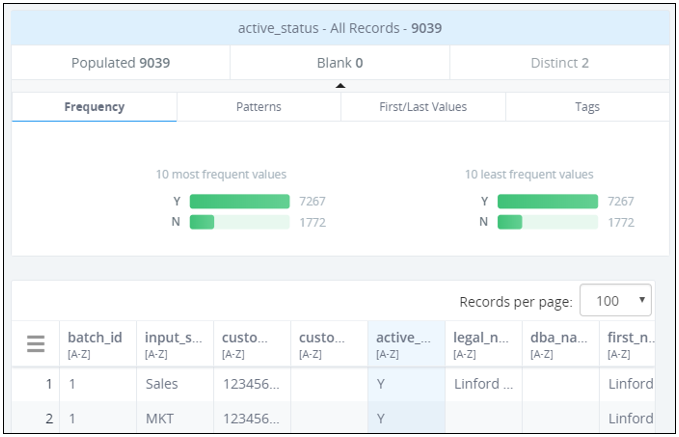
Depending on the selected view mode (Profiling or Data Grid), the workspace area provides all of the data profiling information and data metrics related to the selected data source (as a whole) and/or any specific attribute that you may have selected.
The following example shows information for the active_status attribute in the Data Grid view mode.
The following example shows the data profile of a selected data source in the Profiling view mode.
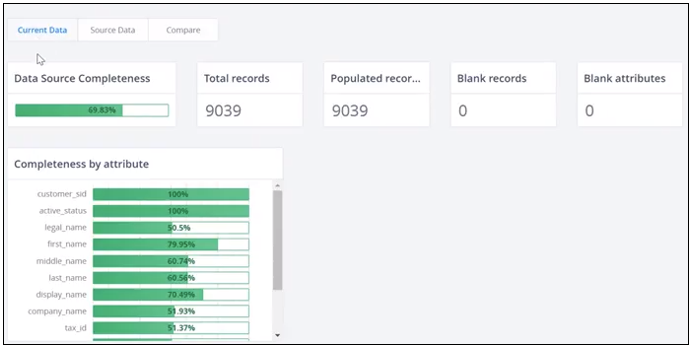
After you apply data quality rules to your data in Omni-Gen™ Personal Edition, you can quickly compare the profiles of your source data with your current data to analyze the impact of the data quality rules. You can think of this as a Before and After scenario.