Administration Settings
|
Topics: |
This section describes how to configure administration settings in Data Quality Monitor (DQM).
Configuring Trend Days
The trend arrows in DQM indicate how the quality of data (or business impact) has changed over time. You can specify the number of days that should be considered for trend arrows. For example, a value of 30 indicates that trend arrows will show how the data quality (or business impact) has changed from 30 days ago up to the current date.
To modify the trend value:
- Navigate to Administration.
- Click the Settings tab.
- Open the dqmTrendDays setting.
- Click Edit Setting, as shown in the following
image.
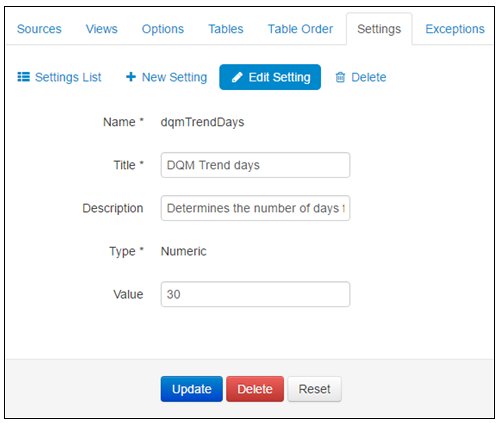
- Set the required days count in the Value field.
- Click Update.