Profile Subject Page
|
Topics: |
The Subject Completeness bar chart displays the percentage of Subject data completeness.
Total records, Populated records, Blank records, and Blank attributes tiles display the number of records corresponding to the name of the tile (Blank/Populated, and so on).
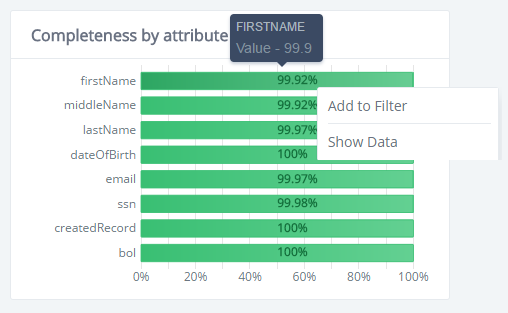
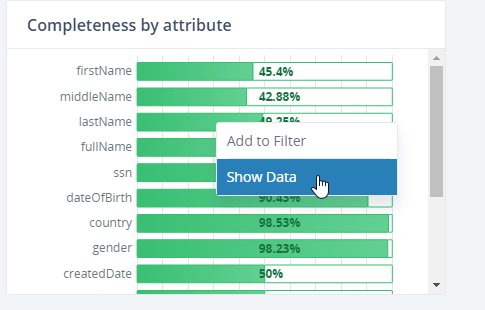
The Completeness by attribute bar chart displays the percentage of completeness per attribute. It shows you a visual representation of the subject you are working with and helps identify where the possible data problem might be.
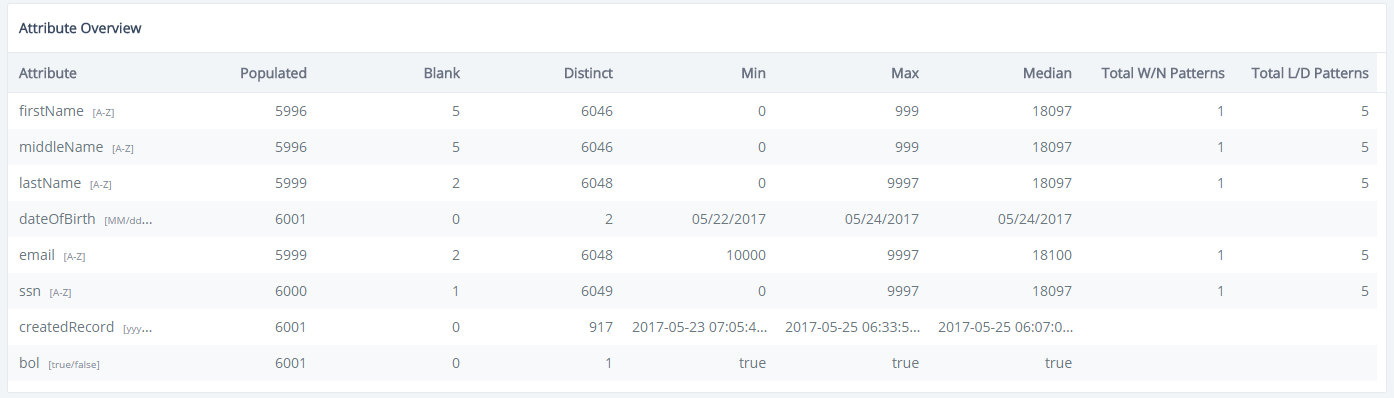
The Attribute Overview table displays attribute data characteristics from different categories:
Populated, Blank, Distinct, Min, Max, Total W/N Patterns and Total L/D Patters.
Using the Add to Filter Option From the Profile Subject Page
The Add to Filter functionality allows you to add a filter tag from the bar chart, tile, or grid. The Add to Filter option is present in the Context menus which are available by right-clicking on most of the following components: tile, bar chart, and table cell. There is no context menu available for the Blank Attributes tile.
After selecting the Add to Filter option, a global filter will be added containing the appropriate criteria.
The following lists describes the specifics for adding a filter from the different context menus:
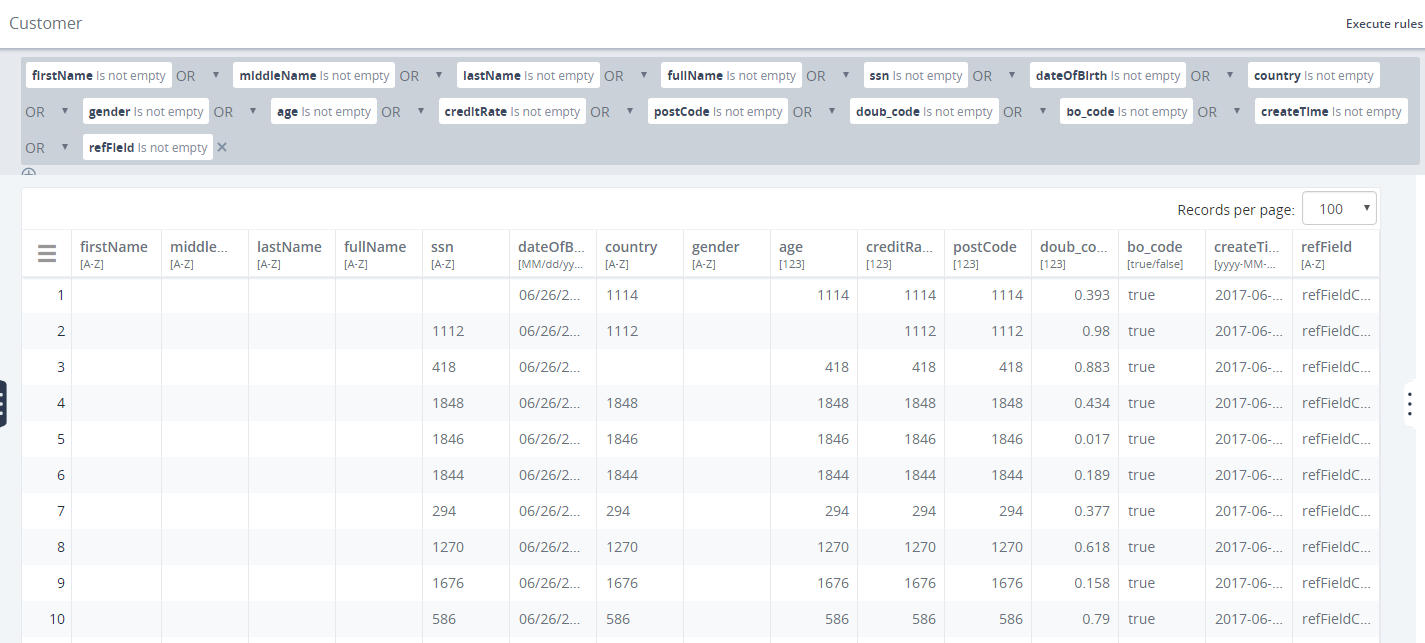
- When adding a filter for the Populated records tile or Subject completeness bar chart, the global filter will contain every attribute in that subject, and the operator indicated that it is not empty, as shown in the image below. Filter tags will be separated with the OR operand.
- You can right-click on the Blank records tile and select
the Add to Filter option. A global filter will be added containing
a series of Filter tags for every column of the subject and each tag
will have property = <column name> and operand is empty.
Filter tags will be separated with the AND operand.

- There is no Add to Filter option for Total records because adding that filter makes no sense since it will show all the records in the system, and they are already displayed on the page.
- You can right-click on the Completeness by Attribute bar charts and select Add to Filter. As a result, the Filter tag will be added to the global filter having property = <column name> and operand is not empty (or is empty if subject is empty).
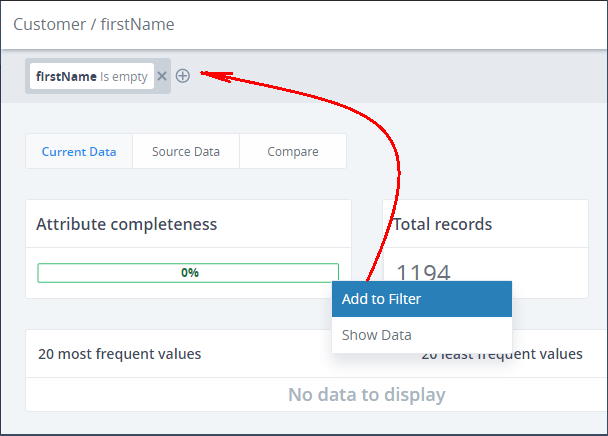
- You can right-click the Attribute name for a specific column in the Attributes Overview table and select the Add to Filter option from the context menu. The filter tag will be added with property = <column name you clicked on>, operand Equals, and value = <empty>. You will need to enter values for them.
- You can right-click the Populated value for a specific column in the Attributes overview table and select the Add to Filter option from the context menu. The filter tag will be added with property = <column name of the bar you clicked on> and operand is not empty.
- You can right-click the Blank value for a specific column in the Attributes overview table and select the Add to Quick Filter option from the context menu. The filter tag will be added with property = <column name of the bar you clicked on> and operand Is empty.
- You can right-click the Min value for a specific column in the Attributes overview table and select the Add to Quick Filter option from the context menu. The filter tag will be added with property = <column name of the bar you clicked on>, operand Equals, and value = <the min value you clicked on>. The Attribute Overview table will be filtered according to the filter criteria.
- You can right-click the Max value for a specific column in the Attributes overview table and select the Add to Quick Filter option from the context menu. The filter tag will be added with property = <column name of the bar you clicked on>, operand Equals, and value = <the max value you clicked on>. The Attribute Overview table will be filtered according to the filter criteria.
- There is no Add to Filter option for the Distinct, Total W/N Patterns, Total L/D Patterns columns, and the Attribute Overview table header.
Using the Show Data Option From the Profile Subject Page
You can navigate to the Data table and see data according to the selected item in the on-screen filter or global filter data by selecting Show data from the context menu. The presence of an On-Screen filter and global filter on the Data table page depends on the selected bar chart on the Profile page.
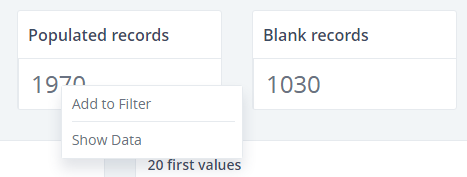
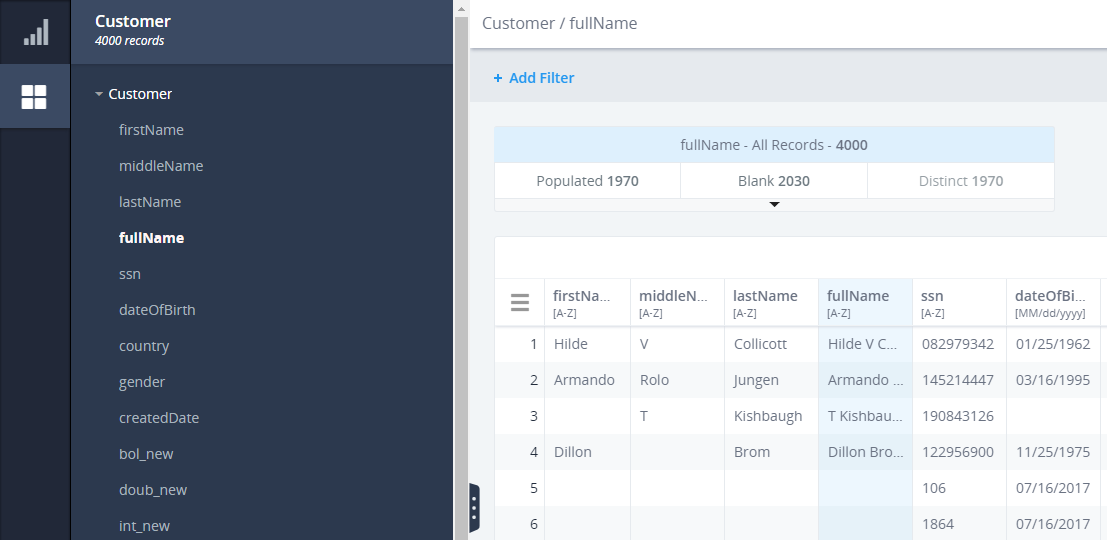
You can right-click on any tile, table cell, or bar chart and select the Show Data option, as shown in the following image.
The following list shows how the Show Data option applies towards each different component.
- For the Populated records tile, the same filter will be set for the Add to filter option, and the Data table page will open with
Populated records. None of the table columns will be selected.
- The behavior will be the same for Blank records, but the Data table page will open with Blank records.
- For Total tile, the Data table page will open with all records shown.
- There is no Show Data option for the Blank attributes tile.
- For the Subject Completeness bar charts, results will be the same as the Populated records tile. None of the table columns will be selected.
- For the Completeness by attribute bar chart:
- If you right-click the bar representing the Populated values, the Data table page for the selected column will open. The Column Profile pane has Populated selected.
- If you right-click the bar part representing the Empty values, then the Data table page for the selected column will open. The Column Profile pane has Empty selected.
- You can right-click and select Show Data from every
column at the Attribute Overview table. For example:
- Populated/Blank. The Data table page opens with Populated/Blank records displayed for the selected column and with Populated/Blank tab in On-Screen filter selected.
- Min column. The Data table page opens with the selected column. The On-Screen Column Profile is switched to the First/Last values tab and the first value in the First tab is selected.
- Max column. The Data table page opens with the selected column. The On-Screen Column Profile is switched to the First/Last values tab and the last value in the Last tab is selected.
- When you right-click anywhere else in the Attributes overview table row and select Show Data from the context menu, the Data table page opens but none of the grid columns will be selected.
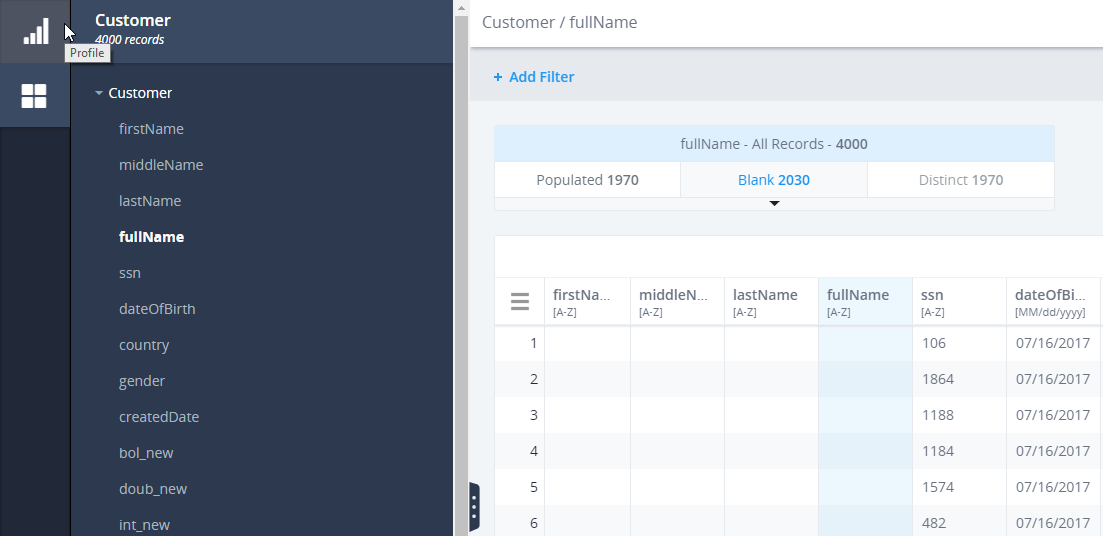
Using the Add to Filter Option From the Profile Attribute Page
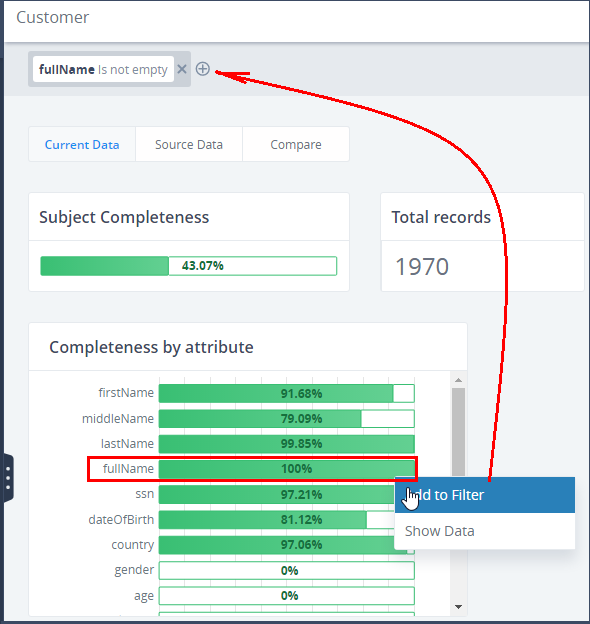
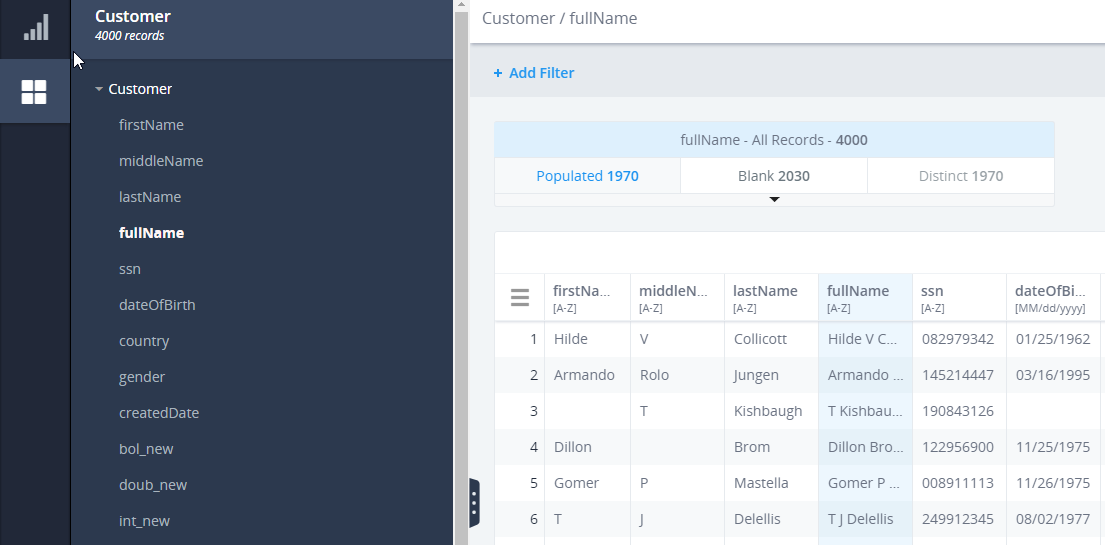
The Add to Filter option can be selected in the Profile/Attribute page from the context menus by right-clicking the tile and bar chart components. After clicking Add to Filter, the filter tag will be added to the global filter, as shown in the following image.
The following list describes the results of adding filters from different context menus.
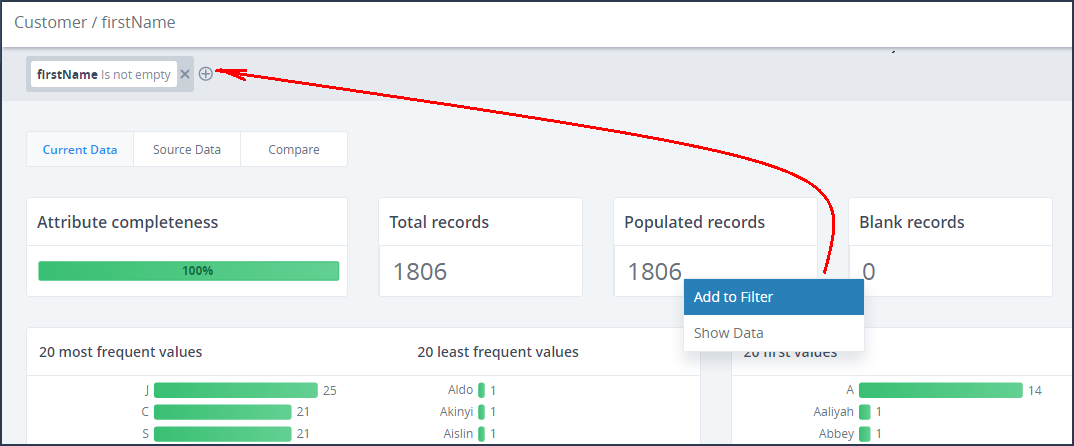
- When adding a filter for the Populated records tile or Completeness by Attribute(green bar), the behavior will be the same:
the global filter will be added
for the selected attribute in the tree and contains the is not empty operator, as shown in the following image.
- When adding a filter for the Blank records tile or Completeness by Attribute (the un-filled white bar), the global filter
will
be added for the selected attribute in the tree and contains operator is empty, as shown in the following image.
- There is no Add to filter option for Total records and Distinct records tiles.
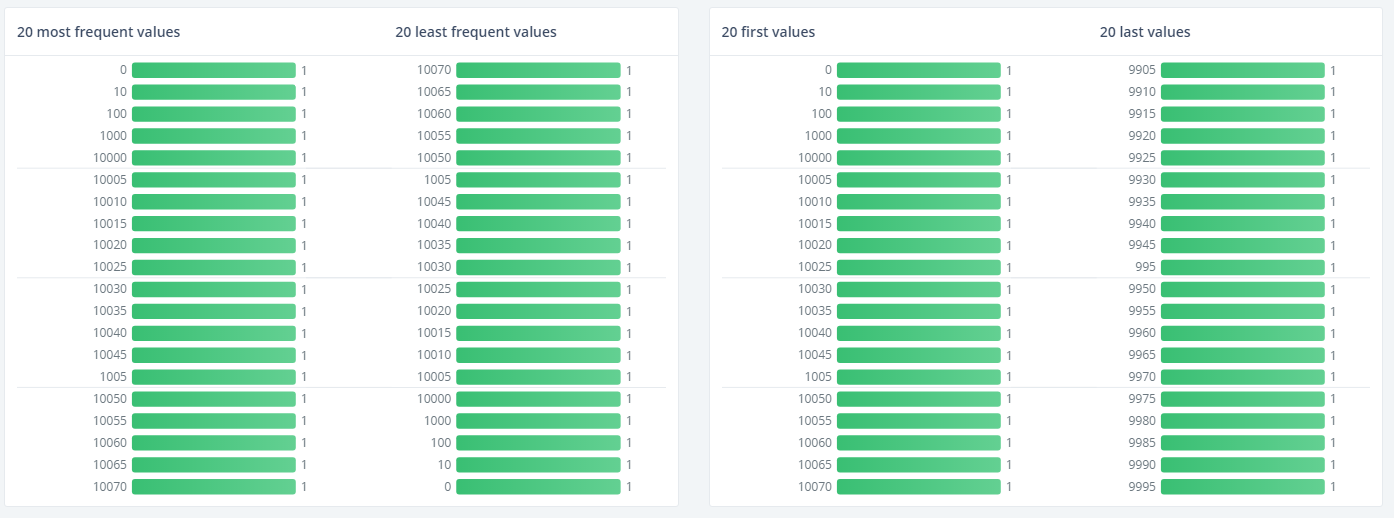
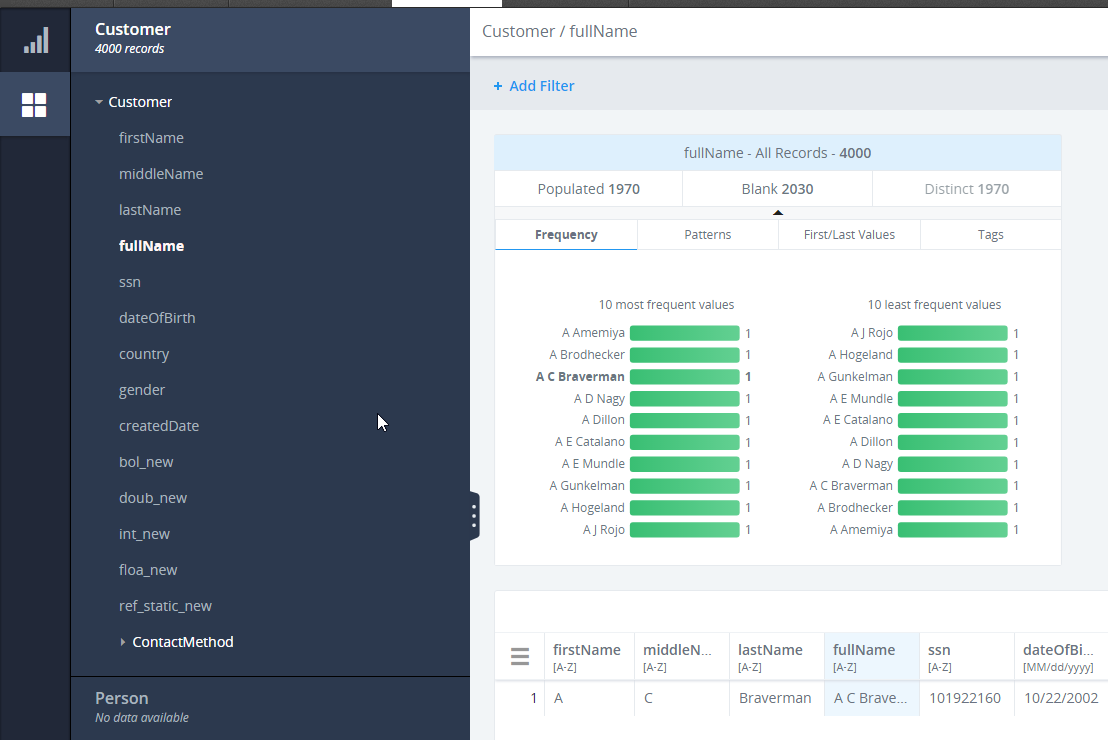
You can also open the context menu by right-clicking either the bars, name of the bars, or the value in the 20 most/least frequent values, 10 first/last values, 20 most/least frequent patterns, or tags.
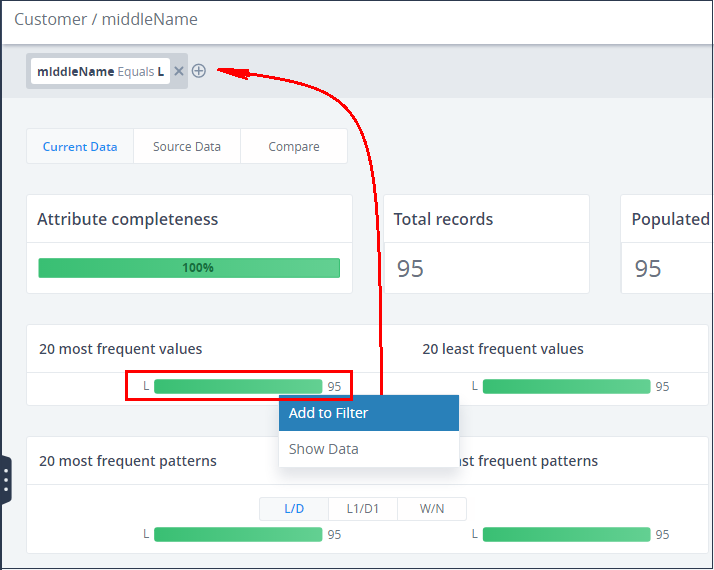
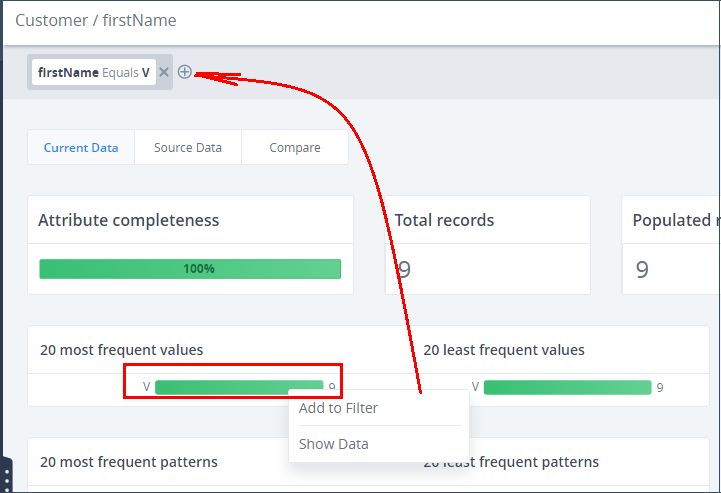
- You can right-click on the 20 most frequent values, 20 least frequent values, 10 first values, and 10 last values charts,
and select Add to Filter. The filter tag will be added with
property = <column name of the bar chart you clicked on>,
operand Equals and value = <the value you clicked on>. The attribute
page will be filtered according to the filter criteria, as shown in the following image.
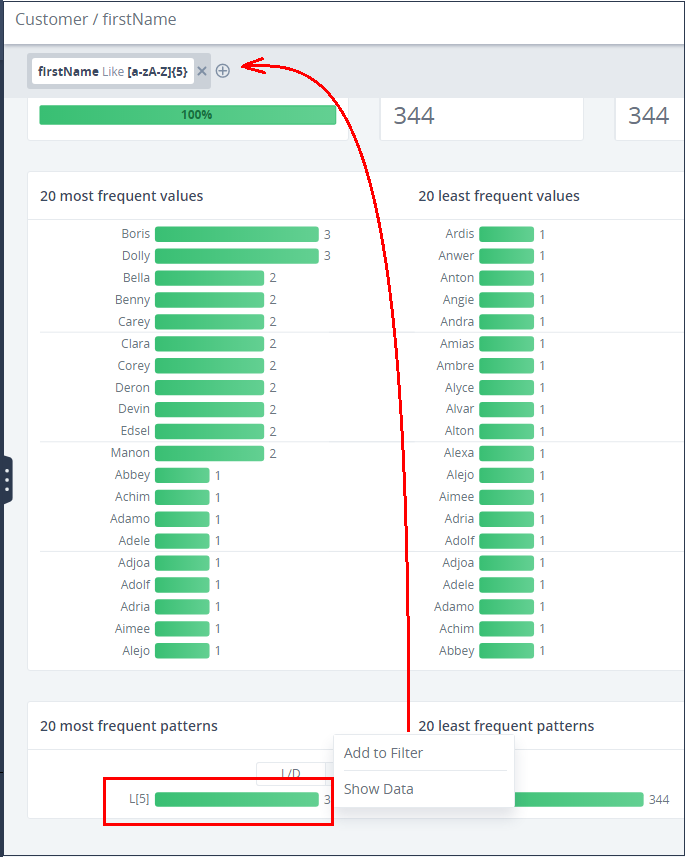
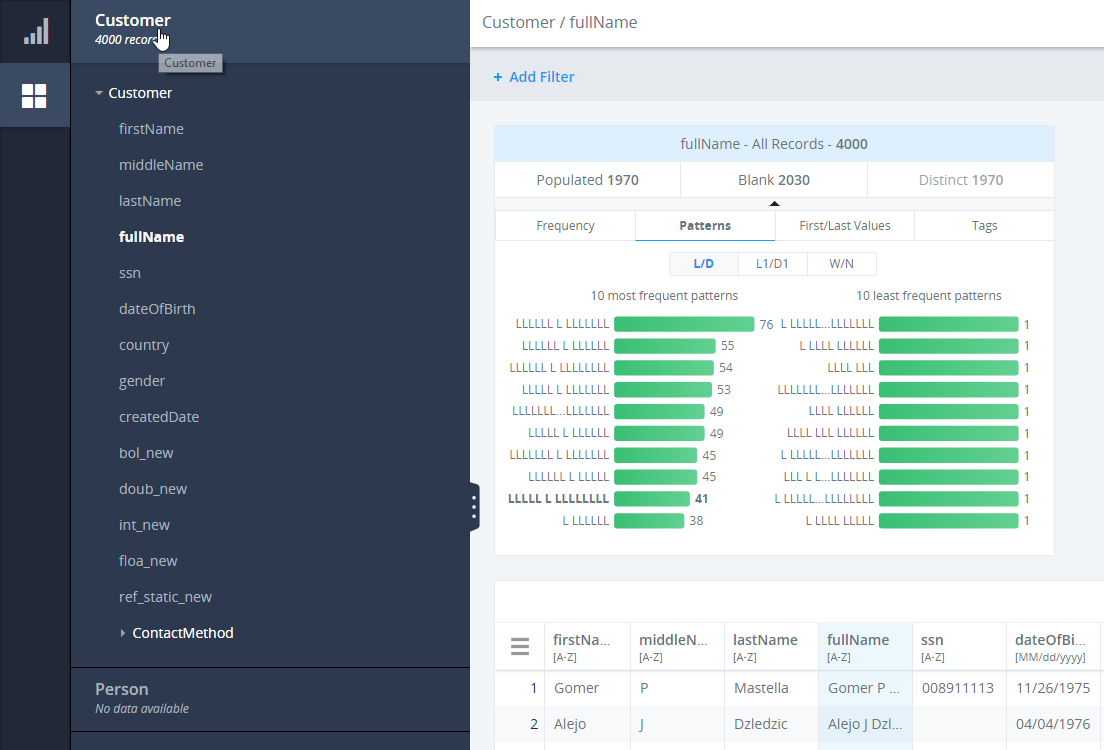
- When you right-click the (L/D, L1/D1, W/N) bar charts pattern
and select Add to Filter, the filter tag will be added with
property = <column name of the bar chart you clicked on>,
operand Like, and value = <the value you clicked on transformed
to RegEx format>. The Attribute page will be filtered according to the filter criteria, as shown in the following image.
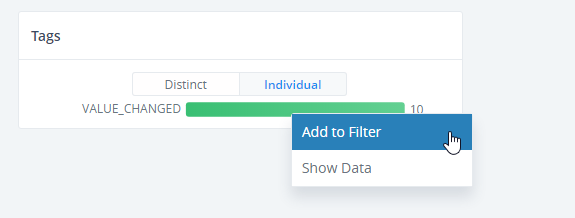
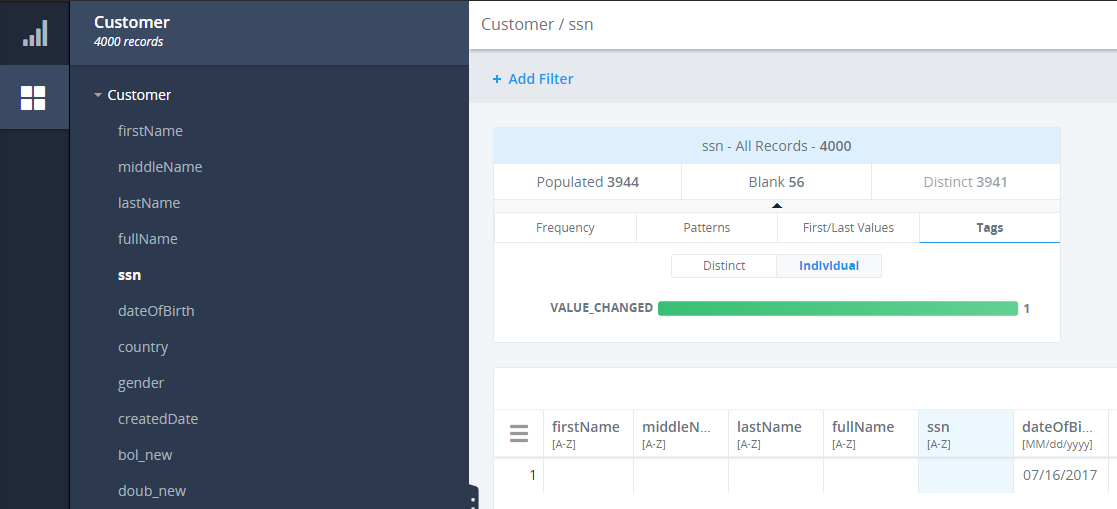
- You can select Add to Filter for the Tags section, and select either the Distinct or Individual tab. The
filter tag will be added with property = <column name of the
bar chart you clicked on>, operand Tagged with, and value =
<tag label>. The Attribute page will be filtered according to the filter criteria, as shown in the following image.
There is a delimiter line between each of the five bar charts for each bar chart section.
Once a filter is added, the Attribute page will be filtered according to the filter criteria.
Using the Show Data Filter Option From the Profile Attribute Page
You can navigate to the Data table and see data according to the selected item in the filter or global filter data by selecting the Show Data from the context menu. The presence of a filter and global filter on the Data table page depends on the selected bar chart on the Profile page.
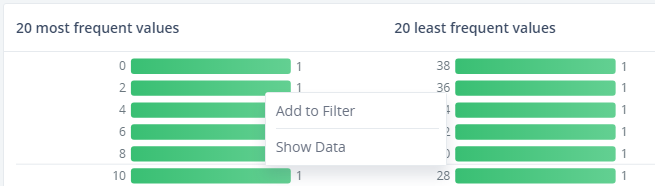
You can right-click on any tile, table cell, or bar chart and select Show Data, as shown in the following image.
The following list describes the different functionalities of Show Data for each of the various components.
- For the Total records tile, the Data table page opens
with no tab selected in the filter. The corresponding attributes
are selected in the table, and all records are displayed.
- For the Populated records tile, the Data table page opens
with the Populated records tab selected in the filter. The corresponding
attributes are selected in the table, and populated records are displayed.
- For the Blank records tile, the Data table page opens with the blank records tab selected in filter. The corresponding
attributes are selected in the table, and blank records are displayed.
- There is no Show Data option for the Blank records tile.
You can right-click on the Attribute Completeness bar charts and select Show Data. The result will be the same for the Populated records tile.
- If you right-click on the green (filled) bars in the Attribute Completeness bar charts, the results will be the same as the Populated records tile. If you right click on the white (unfilled) part in the Attribute Completeness bar charts, the results will be the same as the Blank records tile.
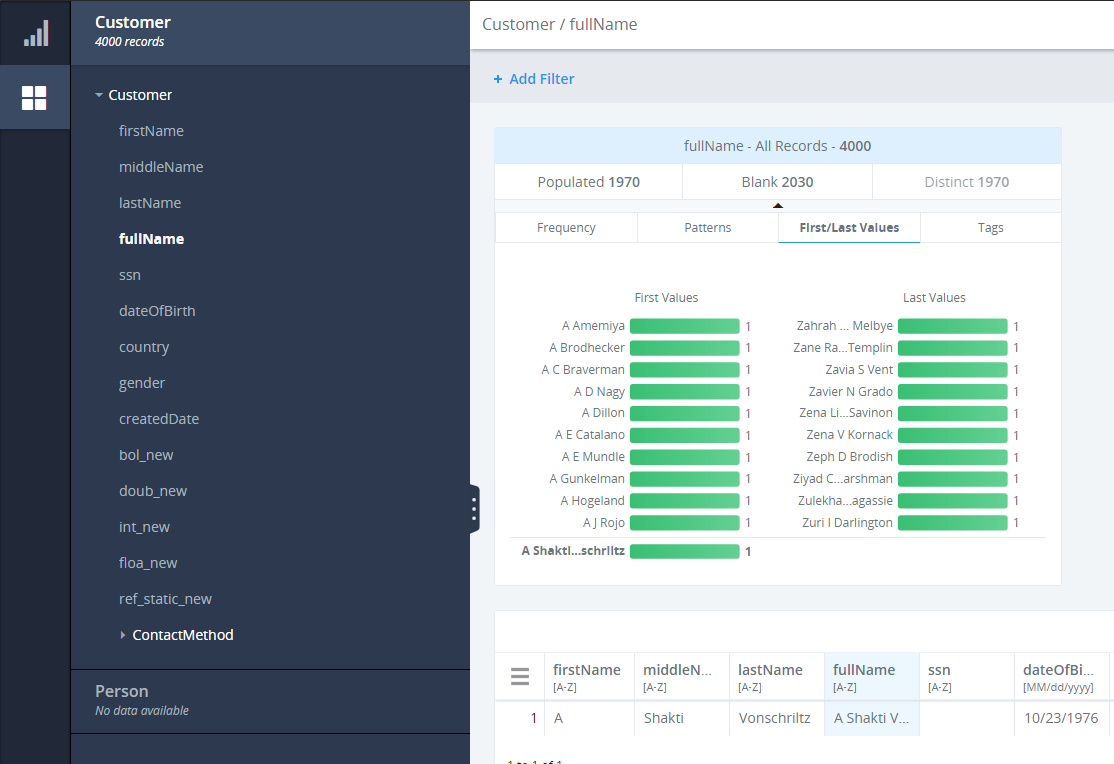
- You can right-click either of the bars or the value names in the 20 Most Frequent values, 20 Least Frequent values, 10 First
values, and 10 Last values charts
and select Show Data from the context menu. The Data table page opens with the column you selected. The Column
Profile has the appropriate tab selected (displaying the same values
you right-clicked on in the Profile) and the actual value used that was selected.
If the value is NOT in the default Column Profile due to space reasons (for example, if you clicked on the 19th Most Frequent value while the Column Profile displayed only the 10 Most Frequent values), the value appears as a special value in the correct place separated by a visual separator.
- You can right-click either the bar or the name of the pattern in
the Letter/Digit, Word/Number patterns bar chart and select Show Data from the context menu. The Data table page opens
with the column you selected. The Column Profile is switched to the Patterns tab, and the pattern you clicked on is selected.
If it does not appear, it is added as a new value at the end of the list separated by a visual separator.
- You can right-click either the bar or the name of the Tags in
the Distinct or Individual tab bar chart and select Show
Data from the context menu. The Data table page opens with
the column you selected. The Column Profile is switched to the Tags tab, and the tag you clicked
on is selected.
When you right-click anywhere else in the Attributes Page, the Show Data option will not be present.