Detecting Errors (Highlight Defects)
|
Topics: |
Highlight Defects is a feature that helps you find inconsistencies and potential errors in the data.
This feature can be accessed using the Highlight defect button in upper-right corner.

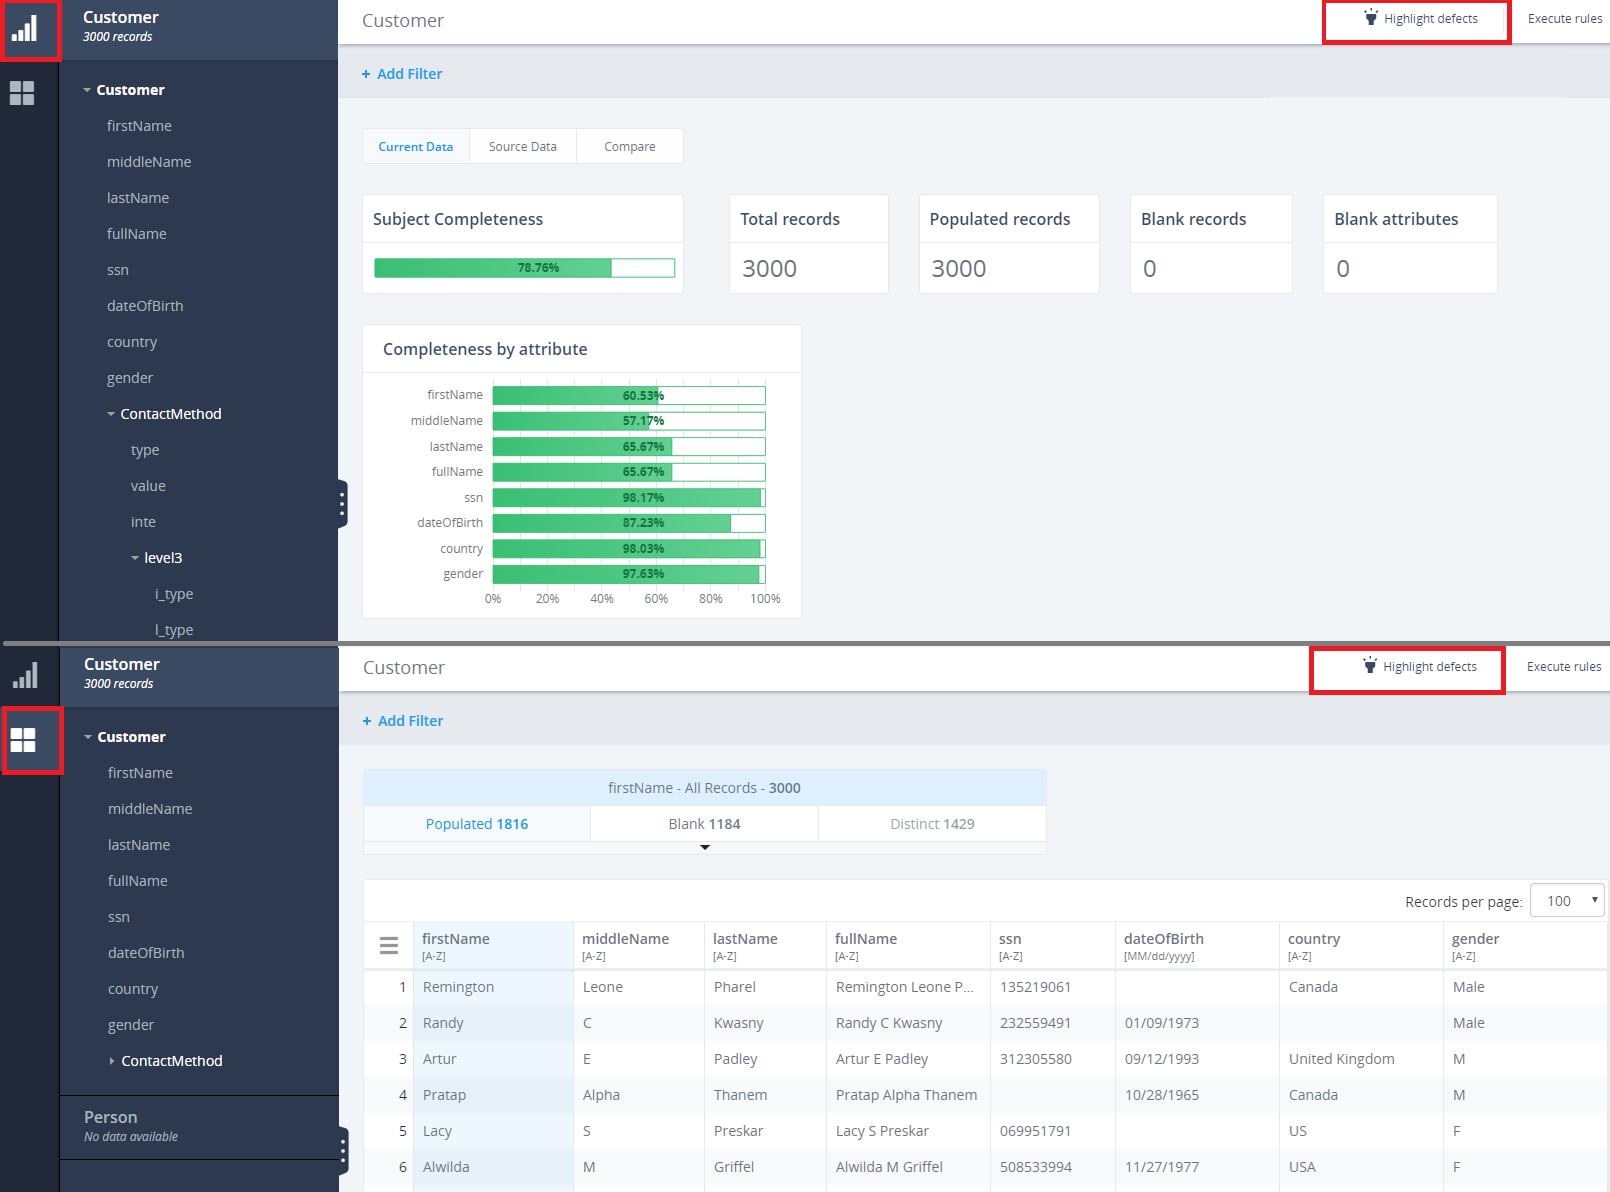
The Highlight defect button is available on the Profile page and on the Data table page, as shown in the following image.
Using the Highlight Defects Feature
To activate this feature, click the Highlight defects button.
When the Highlight defects functionality is enabled, the color of the button is changed to blue and data areas with issues are highlighted in orange, as shown in the following image.
To disable the Highlight defects functionality, re-click the Highlight defects button.
The Highlight defects functionality is saved per session. For example, if you activate Highlight defects and refresh the page, the highlighting defects functionality will be turned off. The same will happen when you decide to reset the session.
The Highlight defects functionality works with the latest data. If you execute some rules, the changes that were applied after processing those rules will also affect highlighting defects. This means that if processing the rules succeeded while the Highlight defects functionality was turned on, the defects highlighting will be re-calculated and the defect will be highlighted based on the new updated data.
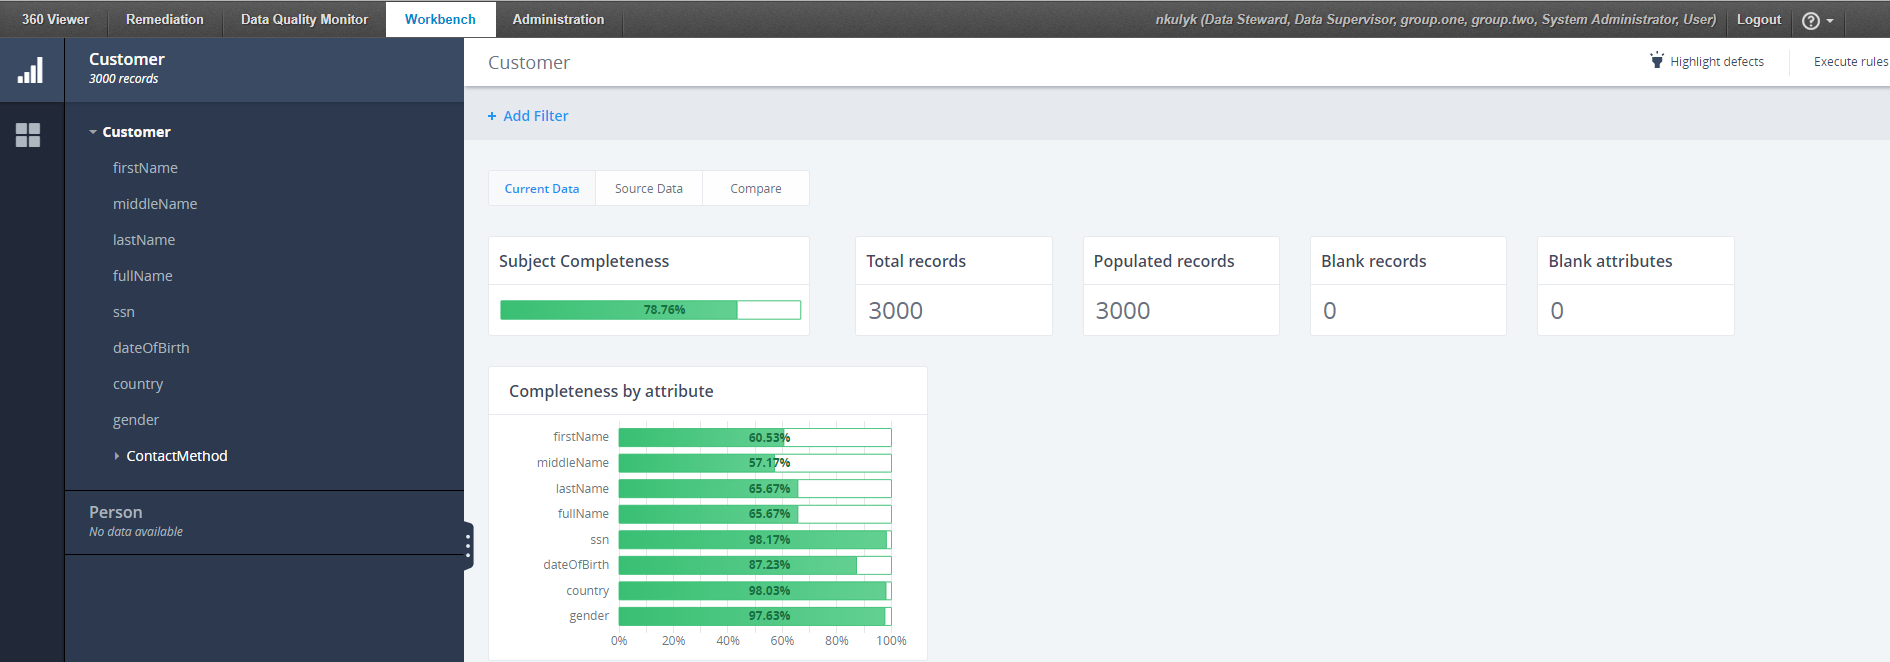
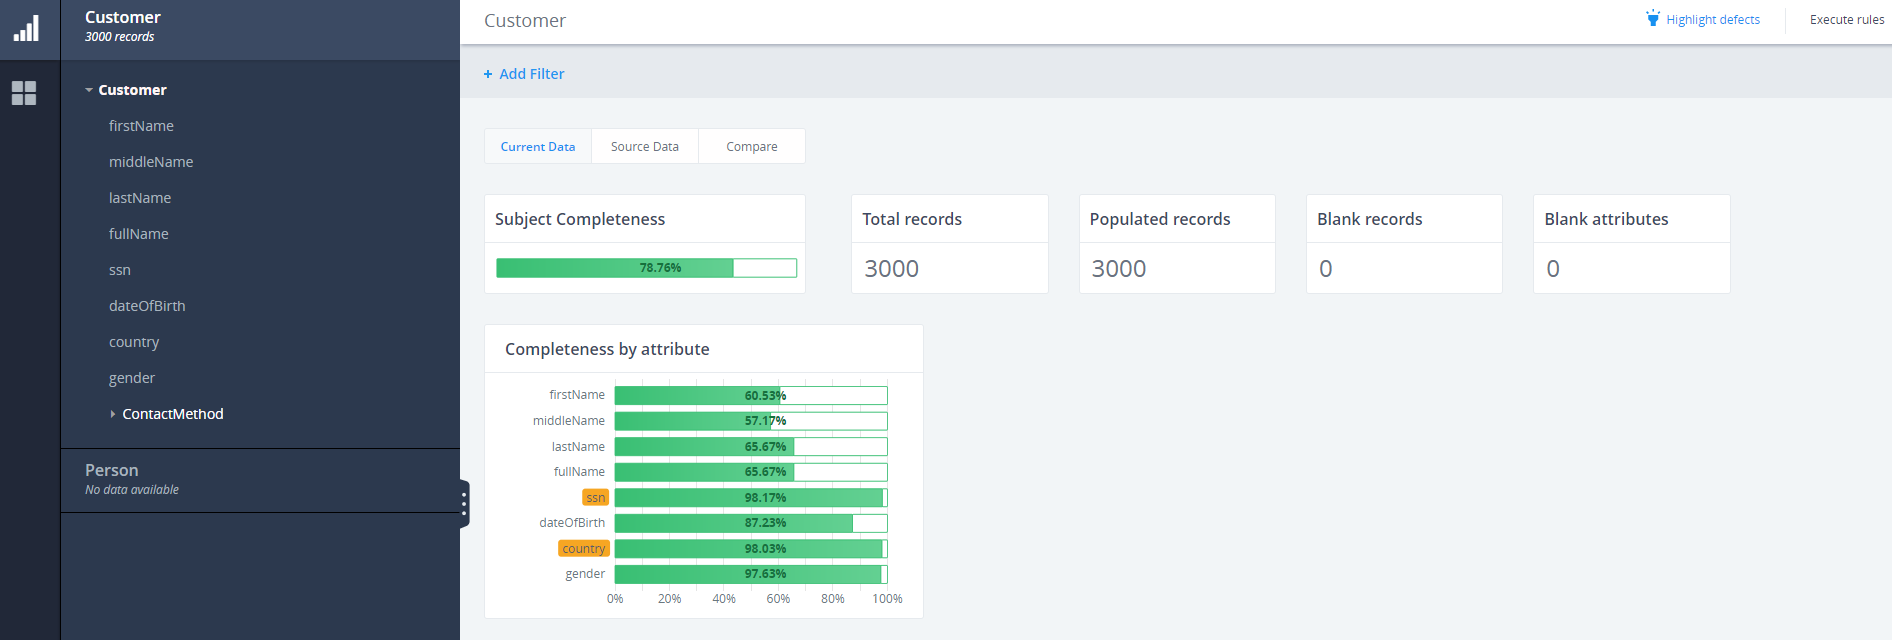
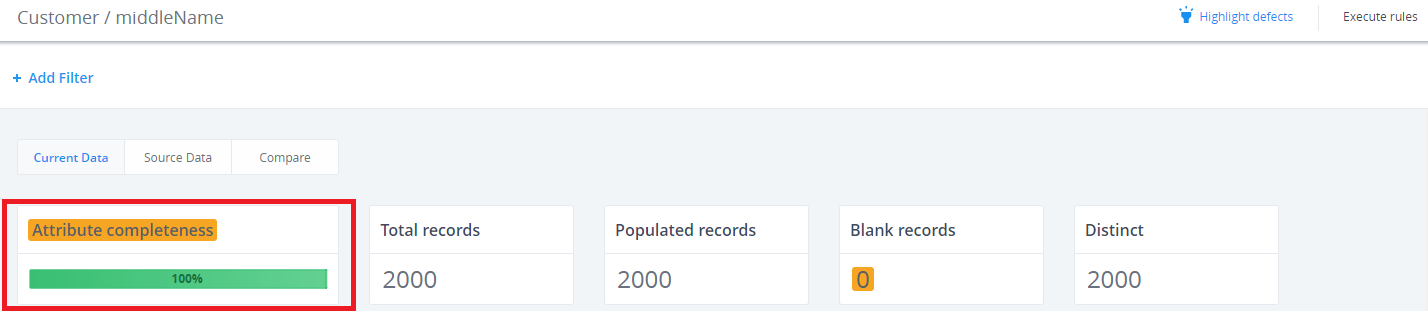
The following image shows how a sample highlighting defect for the Customer Subject appeared before Rules were executed:
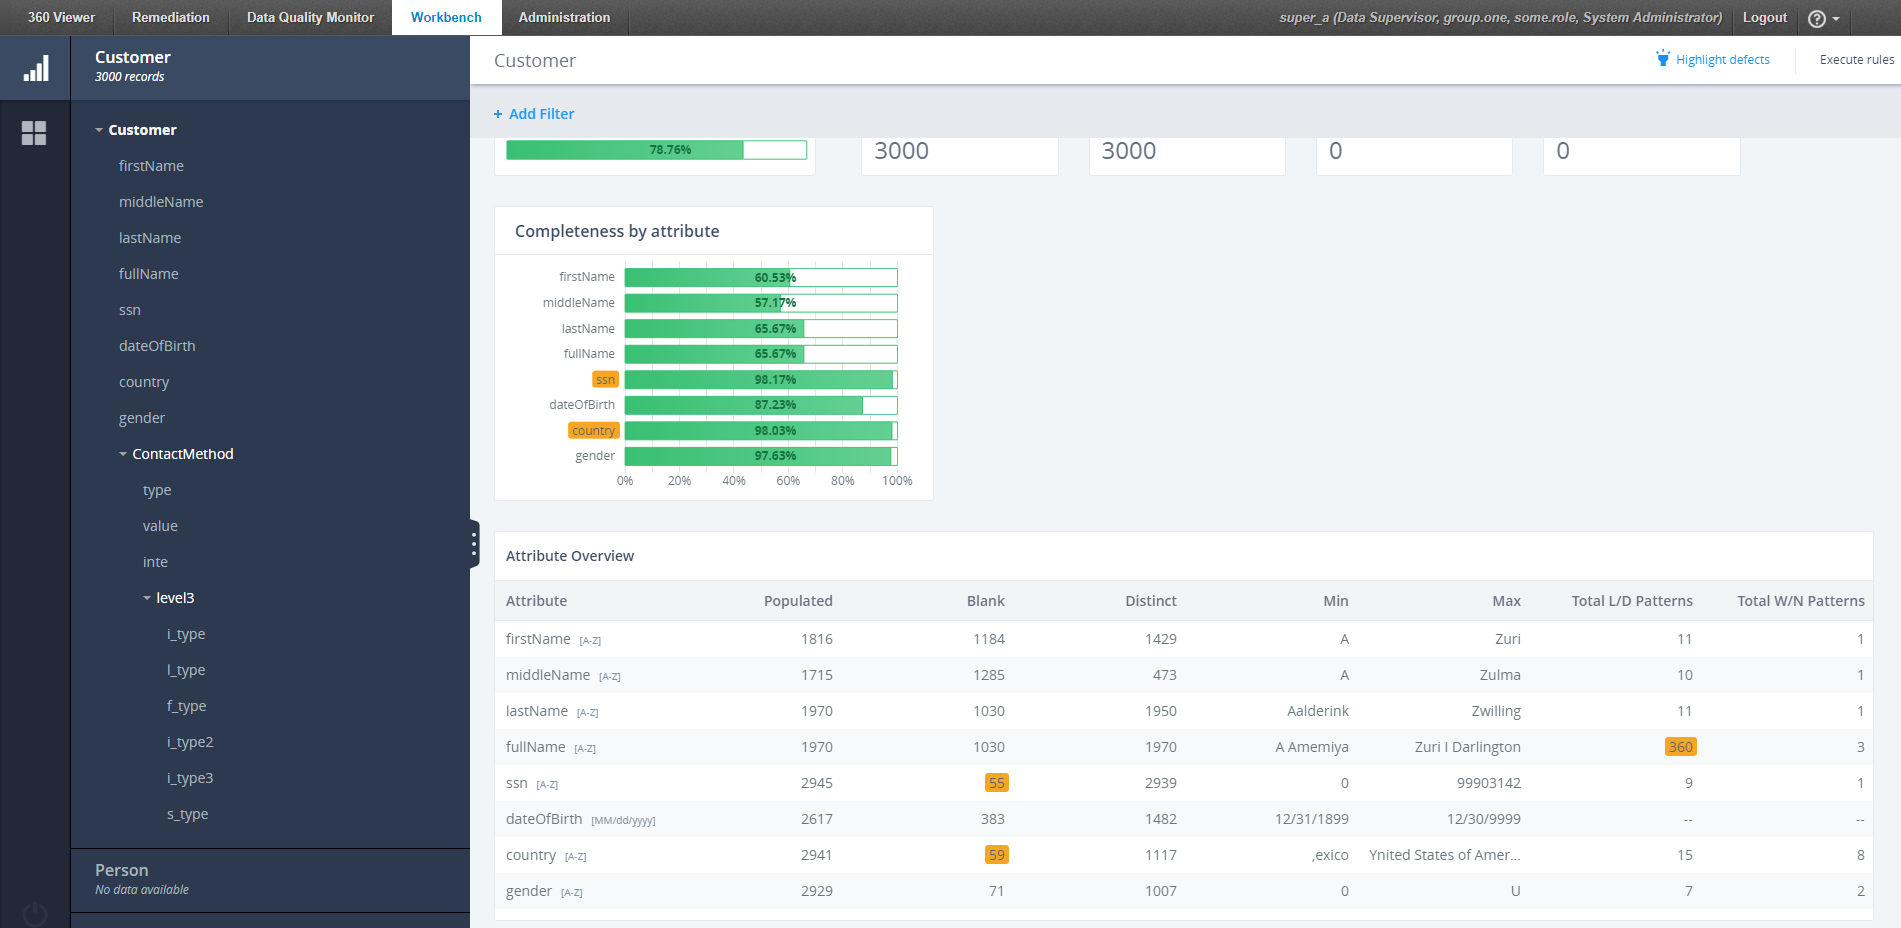
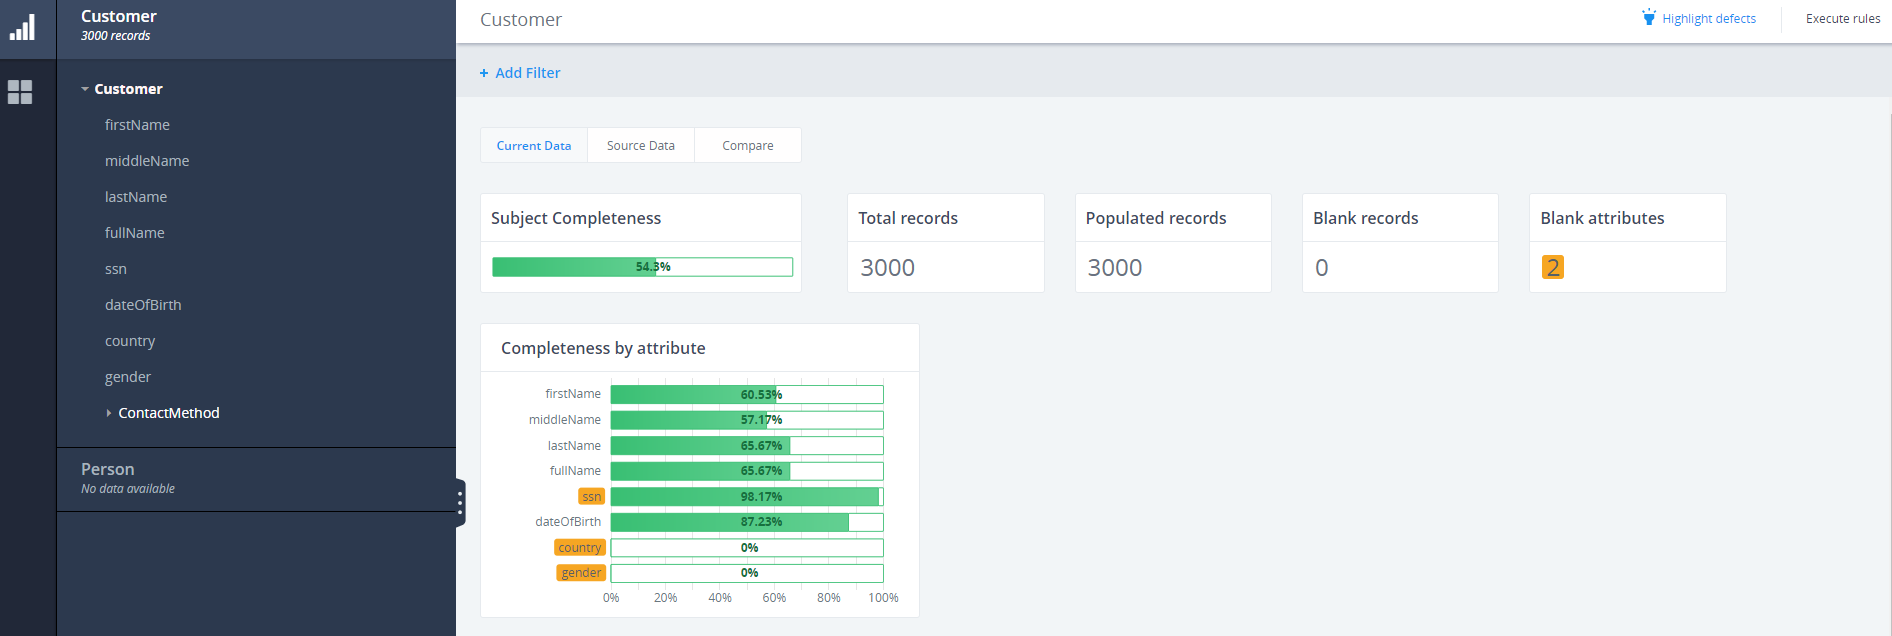
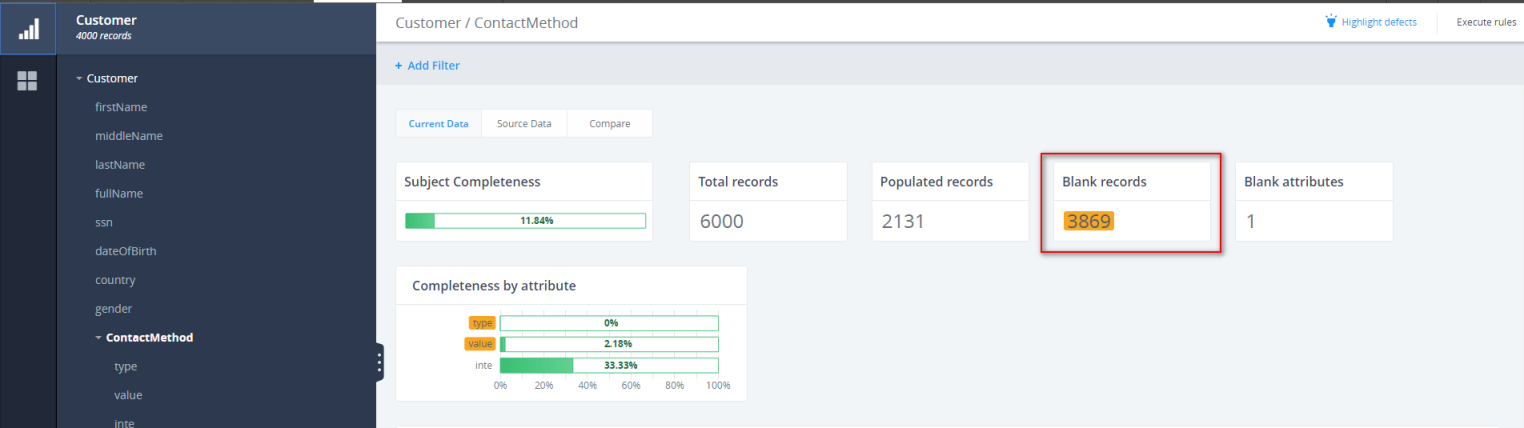
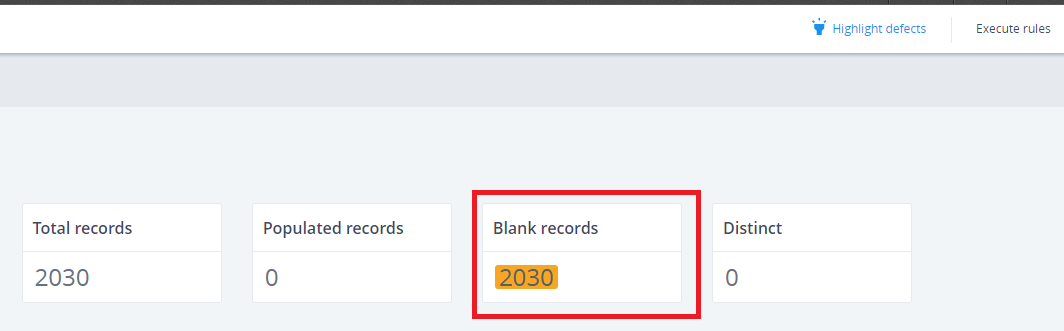
The following image shows how the Highlighting defect for Customer Subject appeared after the Cleanse_SSN operation was applied to the Country and gender attributes:
The same will happen if you apply a Filter while the Highlight defects functionality is activated. In this example, the defects highlighting will be re-calculated and the defect will be highlighted based on filtered data.
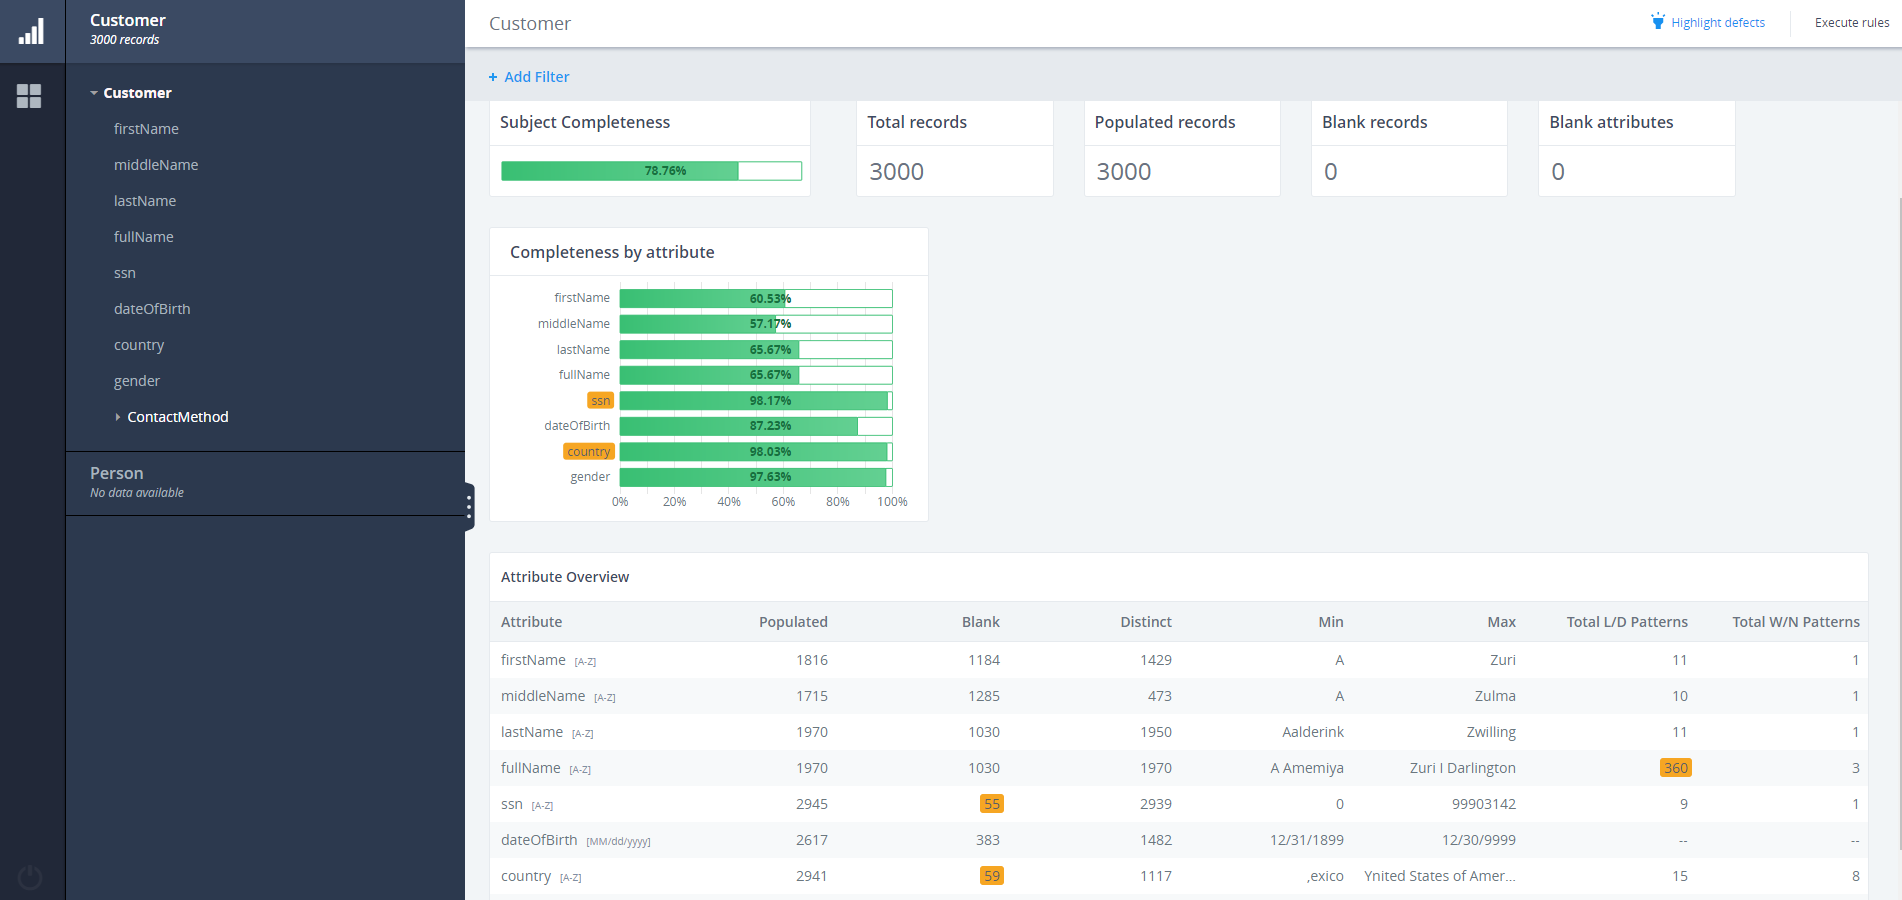
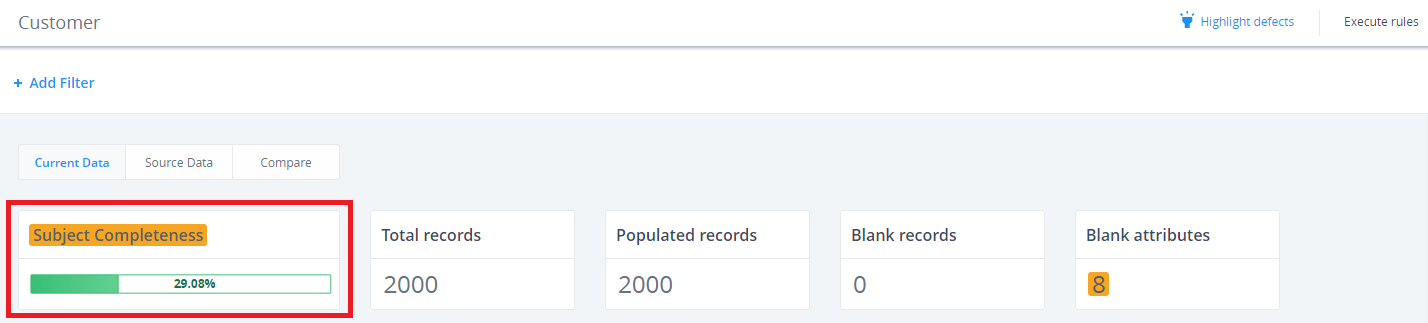
The following image shows how Highlighting defects for the Customer Subject appeared without an added filter:
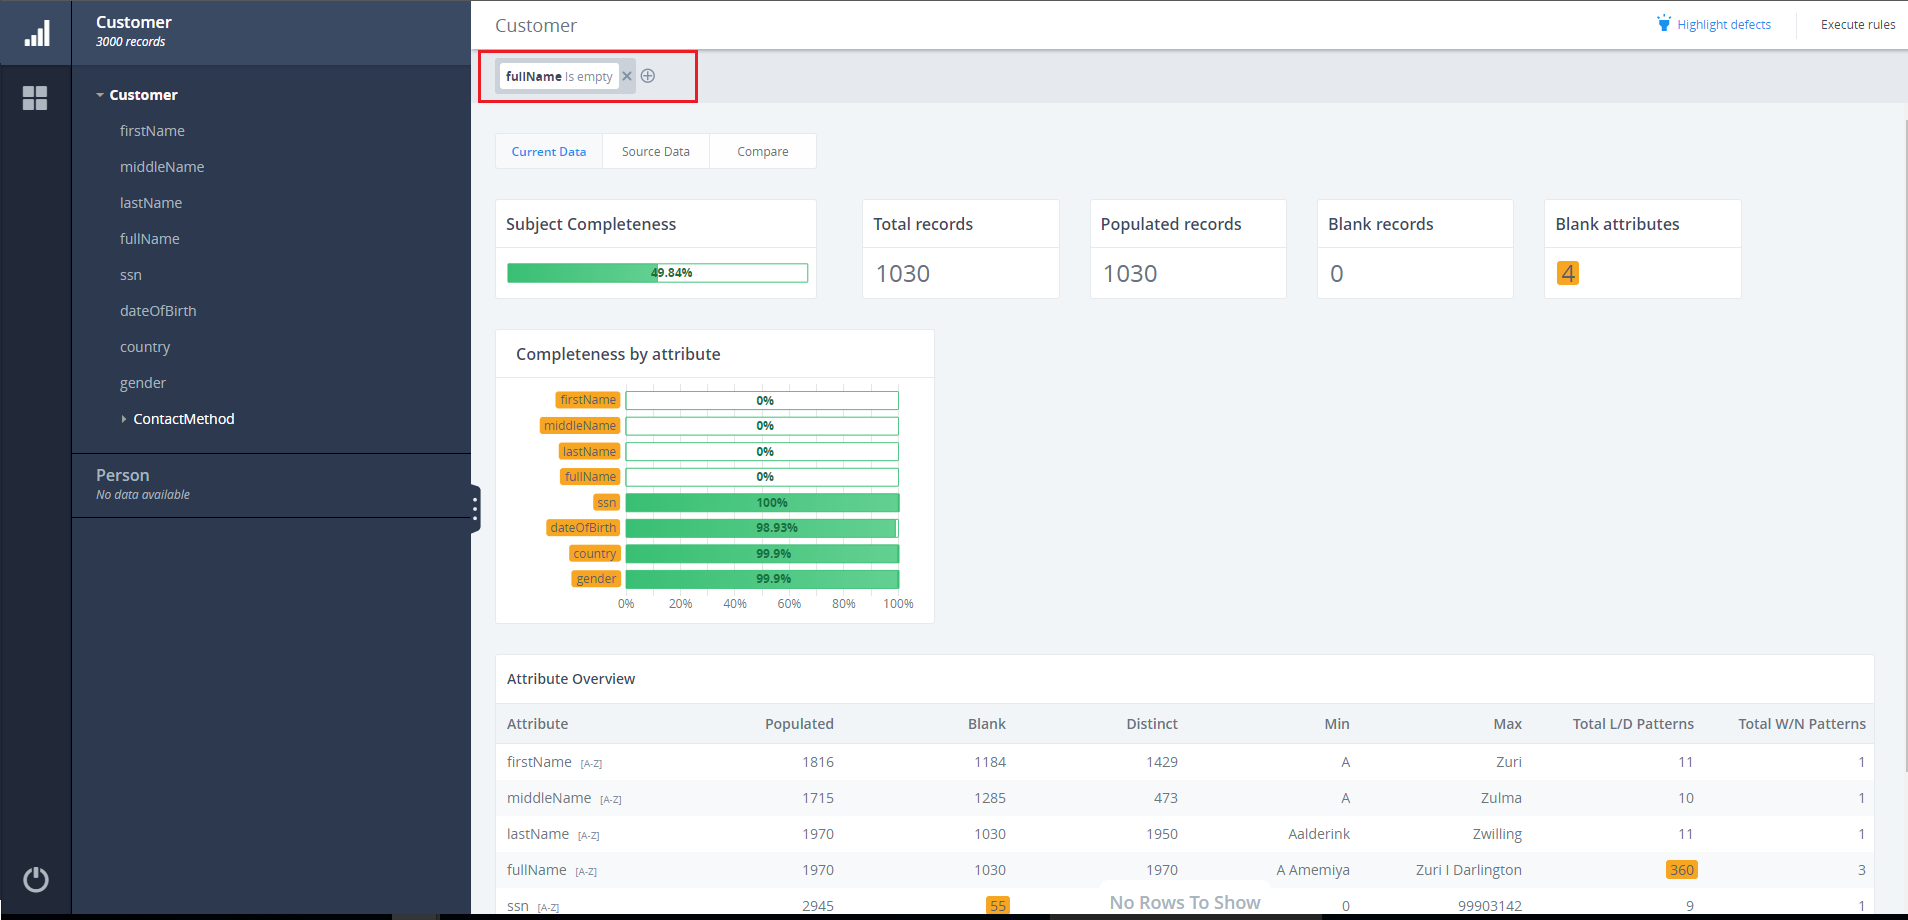
The following image shows how the Highlighting defect for Customer Subject appeared after a Filter was added to the fullName bar chart:
Defining Rules to Determine Whether a Value Should be Highlighted
The Highlight Defects functionality works by placing a highlight_defects.json file in the following directory where the environment is configured:
C:\iWay_OGC\ogc\data\workbench
The highlight_defects.json file contains a set of expression-rules based on which Highlight functionality made the calculation to determine whether a value is to be highlighted.
The expressions can be edited (if needed) inside the JSON file. After OGC Tomcat is restarted, the calculation of the highlight defects will be made according to the updated expressions.
Profiling (Subject)
Highlight defects can be applied to the following bar charts:
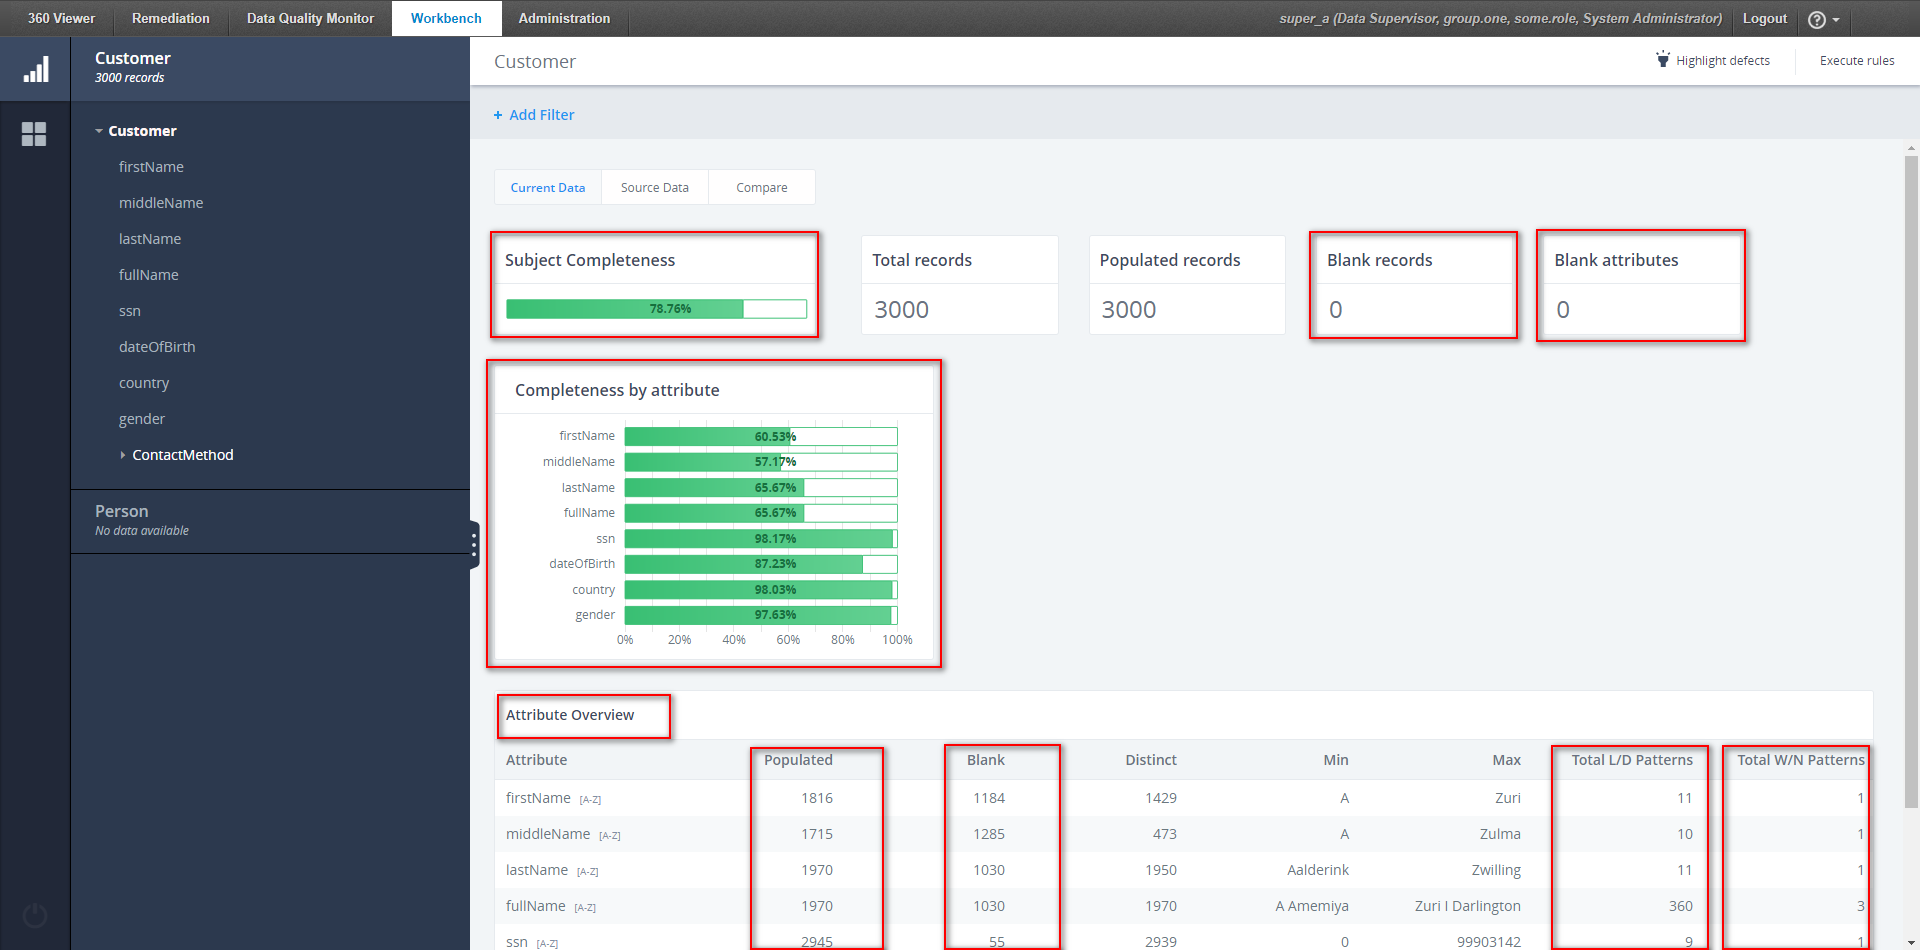
- Subject Completeness. The Subject completeness bar chart is highlighted when the value
drops below the threshold [30%].
If the value does not drop above the threshold [30%], it will not be highlighted.
- Blank records. The blank records number is highlighted if either of the following occurs:
- As a percentage of Total Records above the threshold [10%].
- In total above the threshold [100%].
If the value does not fulfill the criteria above, it will not be highlighted.
- Blank attributes. The Blank attributes number is highlighted if the value is
above the threshold [1].
If the value does not fulfill the criteria above, it will not be highlighted.
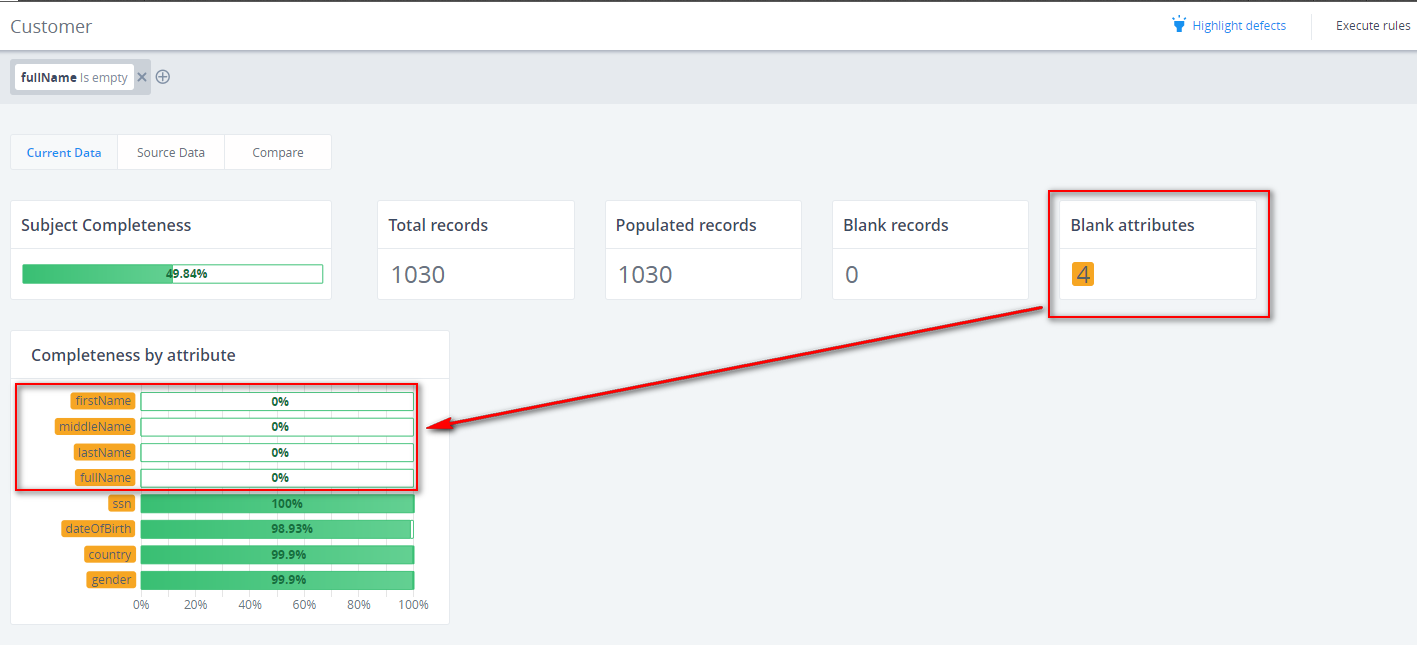
- Completeness by attribute. These bar charts will be highlighted
if the Attribute completeness is either:
- Below the threshold [10%].
- Between thresholds [above 98% but below 100%].

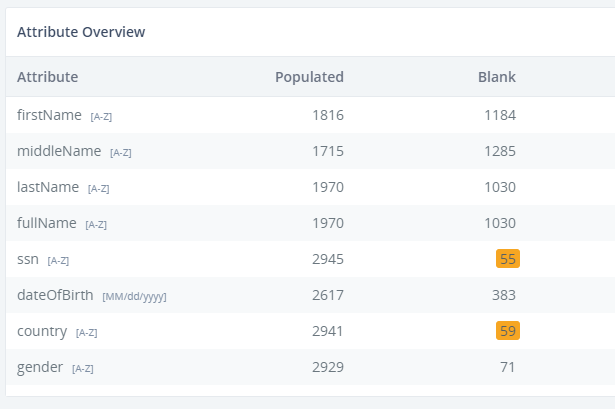
- Attribute Overview. This Blank number is highlighted if the corresponding values are either:
- As a percentage of the Populated/Blank above a threshold [90%]
- As a percentage of the Populated/Blank between thresholds [below 2% but above 0%]
The Total number for patterns is highlighted for the following instances:
- Total W/N Patterns is above the threshold [20].
- Total L/D Patterns is above the threshold [20].

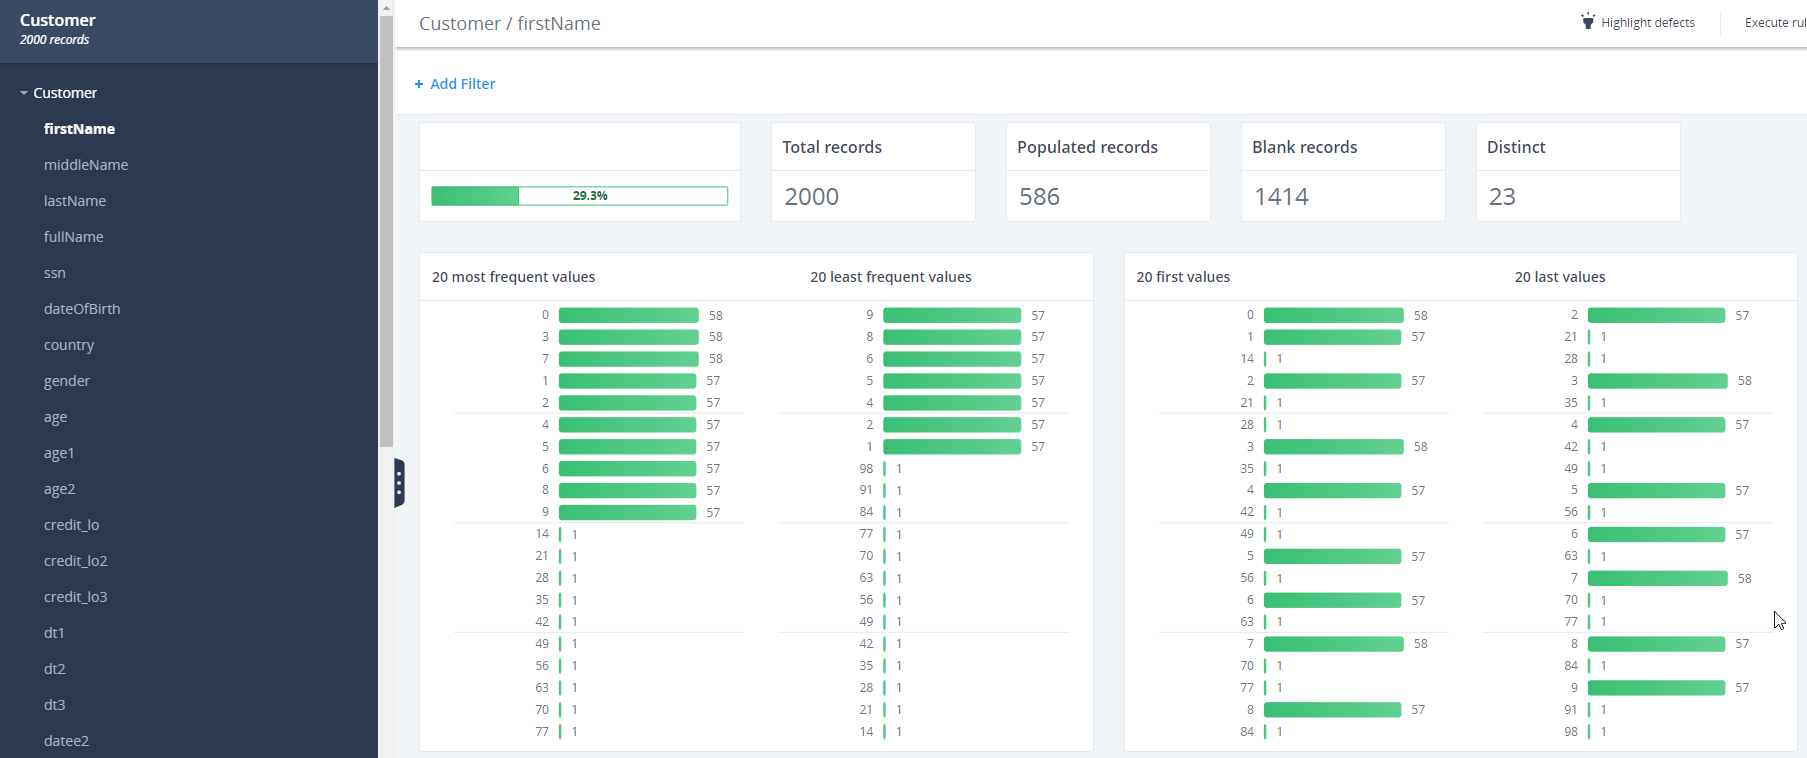
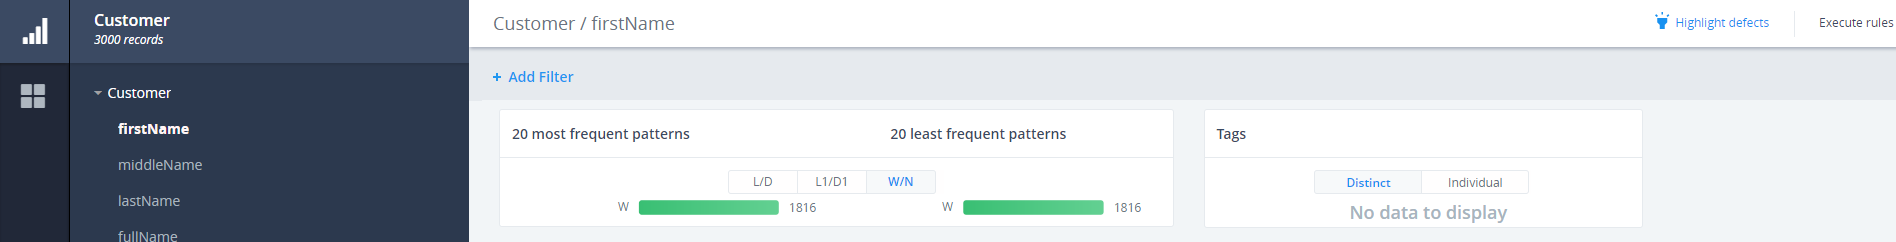
Profiling (Attribute)
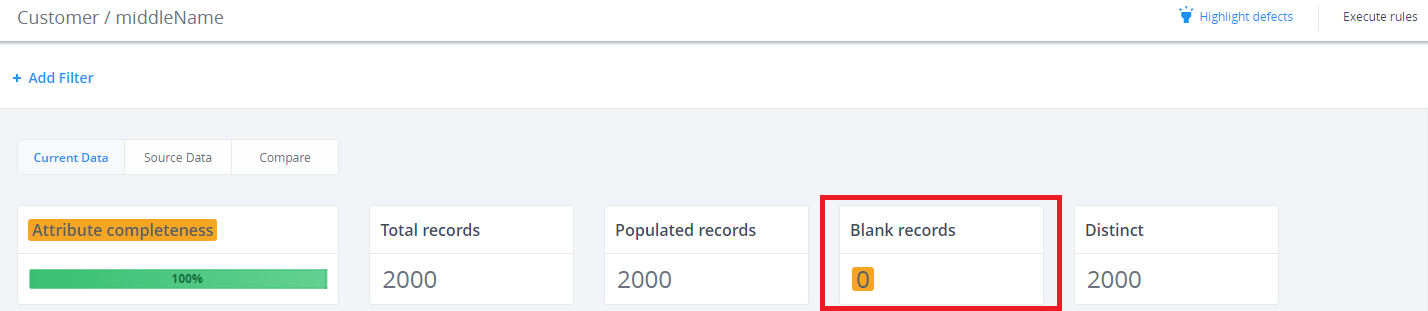
The following image shows the profiling bar charts and sections.

Highlight defects can be applied to the following bar charts:
- Attribute Completeness. This bar chart is highlighted when the value
for Attribute completeness is either:
- Below a threshold [10%].
- Between thresholds [above 98% but below 100%].
- Blank records. This number is highlighted in either one of the following conditions:
- If the percentage of the Populated/Blank is above a threshold
[90%].
- If the percentage of the Populated/Blank is between thresholds [below
2% but above 0%]
.
- If the percentage of the Populated/Blank is above a threshold
[90%].
- The 20 most/least frequent values charts.
To define which of the 20 most and least frequent values charts should be highlighted, the following complex computation should be solved.
TMP_TOTAL := $total;
TMP_DISTINCT := $distinct;
20_THRESHOLD := TOTAL/5;
for each row from top 5 most frequent
do
if $records > 20_THRESHOLD
do
TMP_TOTAL := TMP_TOTAL - $records;
TMP_DISTINCT := TMP_DISTINCT - 1;
done
done
LOW_THRESHOLD := TMP_TOTAL/TMP_DISTINCT;
for each row in least frequent
do
if $records < LOW_THRESHOLD/10
do
highlight
done
done Let's consider the following example:
- 20 most/least frequent patterns charts.
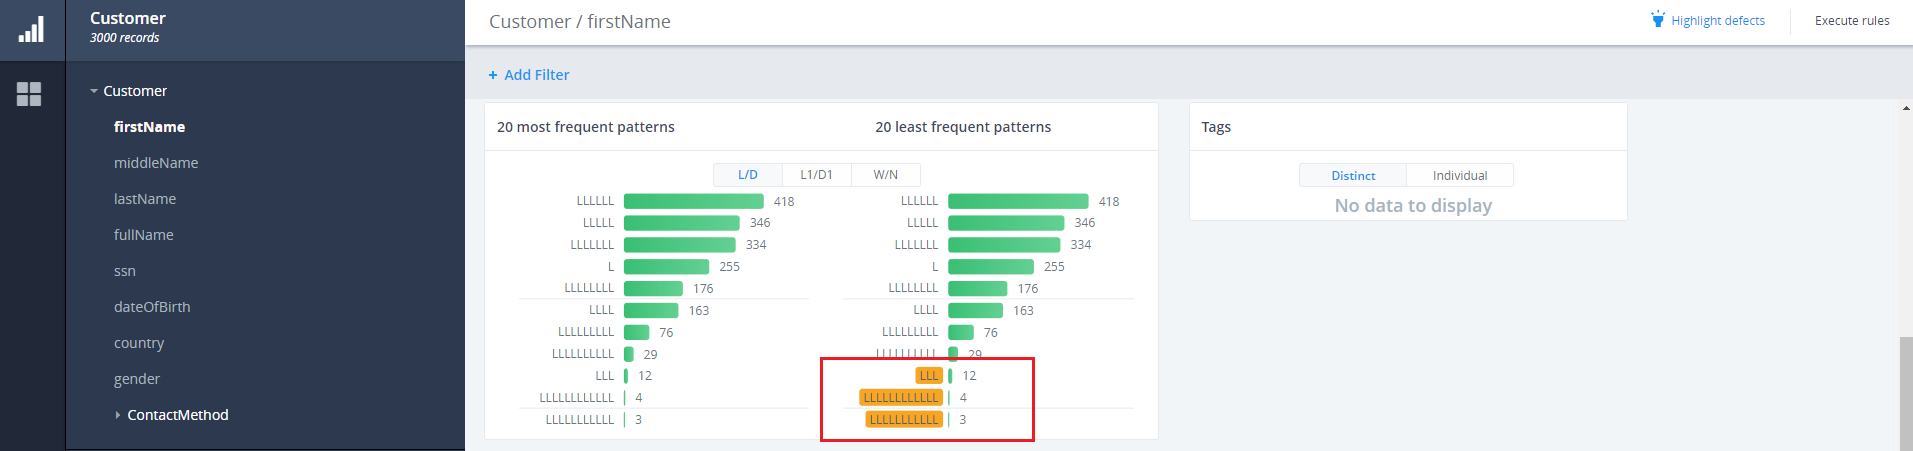
The following image shows the highlighting for 20 most/least frequent patterns charts for the firstName attribute.
The following sample calculations identify which values should be highlighted:
TMP_TOTAL :=2000
TMP_DISTINCT := 23
20_THRESHOLD := TOTAL/5 = 2000/5 = 400(static and doesn't change)
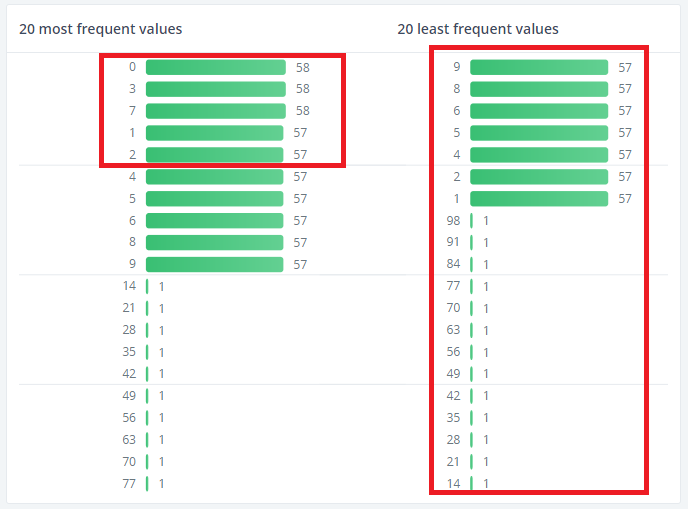
for each row from top 5 most frequent
do
if $records > 20_THRESHOLD
if 58 > 400 (false) done
LOW_THRESHOLD := TMP_TOTAL/TMP_DISTINCT;
LOW_THRESHOLD := 2000/23;for each row in least frequent
do
if 1<8.69 (true)
do highlight
if 57<8.69 (false)
done
done
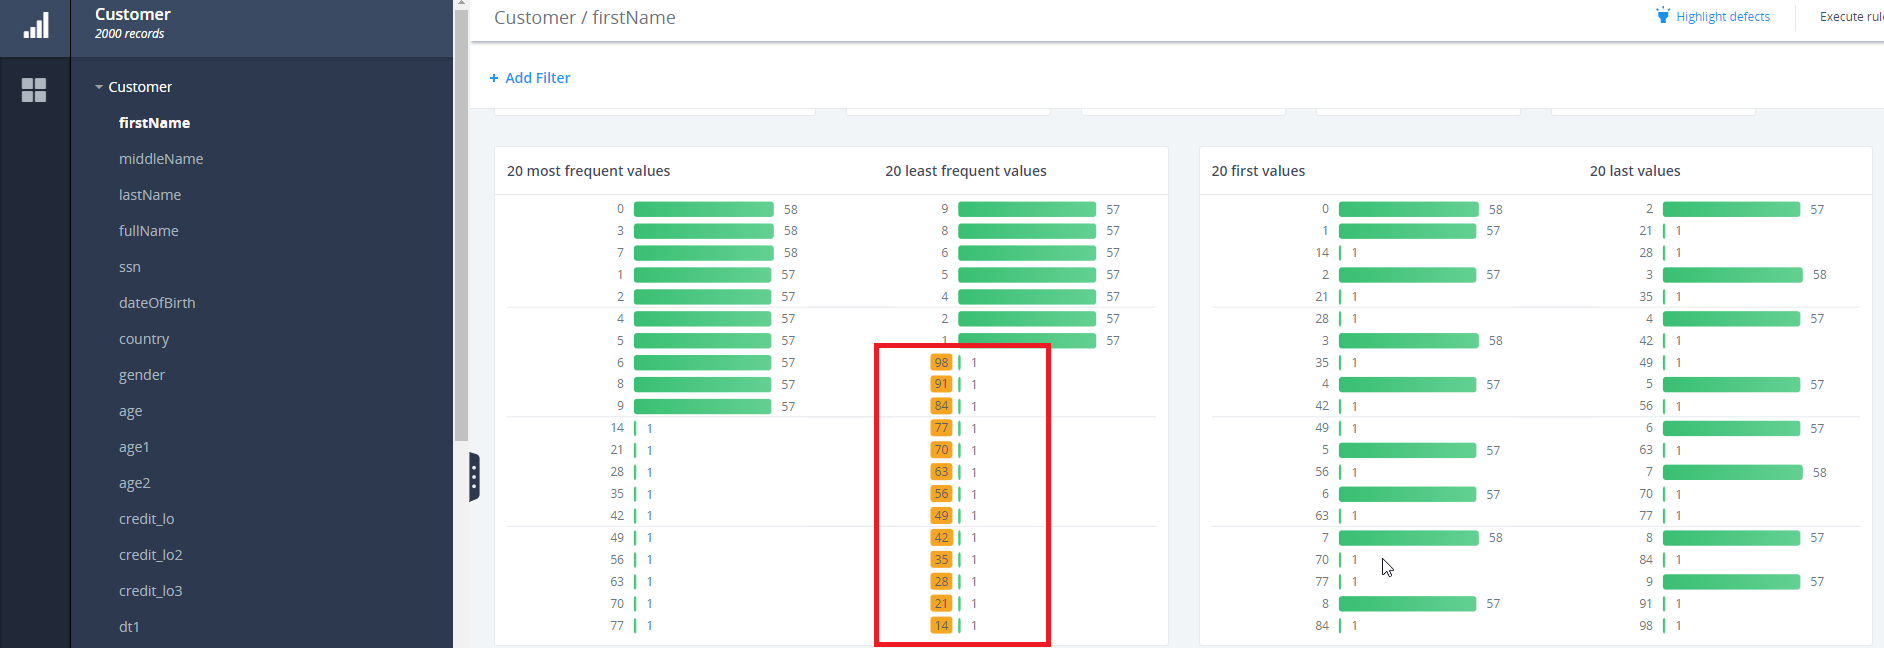
The following image shows the results of the calculation containing the highlighted charts with the value of 1.
Highlighting for 20 of the most and least frequent patterns and charts fulfills the following criteria:
- Patterns with frequency below a threshold [5%].
- If the sum of the 5 most frequent patterns exceeds 60% in
total, and they do not contain a certain set of characters (digits/alpha/specials), then highlight all patterns containing
those sets
of characters.
For example, if the 5 most frequent patterns exceed 60% of the total cases and do not contain digits, then all patterns that do contain digits should be highlighted.
- Patterns with the frequency above the threshold if the number of distinct values is also above the threshold (if the number of distinct values is greater than 100 and the frequency is greater than 25%).
It is easier to define which of the 20 most and least frequent patterns charts should be highlighted based on the following complex computation:
TMP_TOTAL := pattern_total = sum(#records for all most frequent patterns)
TMP_DISTINCT := pattern_distinct = # of rows in most frequent patterns
20_THRESHOLD := TOTAL/5;
for each row from top 5 most frequent
do
if $records > 20_THRESHOLD
do
TMP_TOTAL := TMP_TOTAL - $records;
TMP_DISTINCT := TMP_DISTINCT - 1;
done
done
LOW_THRESHOLD := TMP_TOTAL/TMP_DISTINCT;
for each row in least frequent
do
if $records < LOW_THRESHOLD/10
do
highlight
done
done Let's consider the following example:
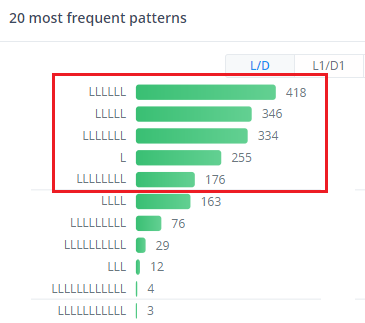
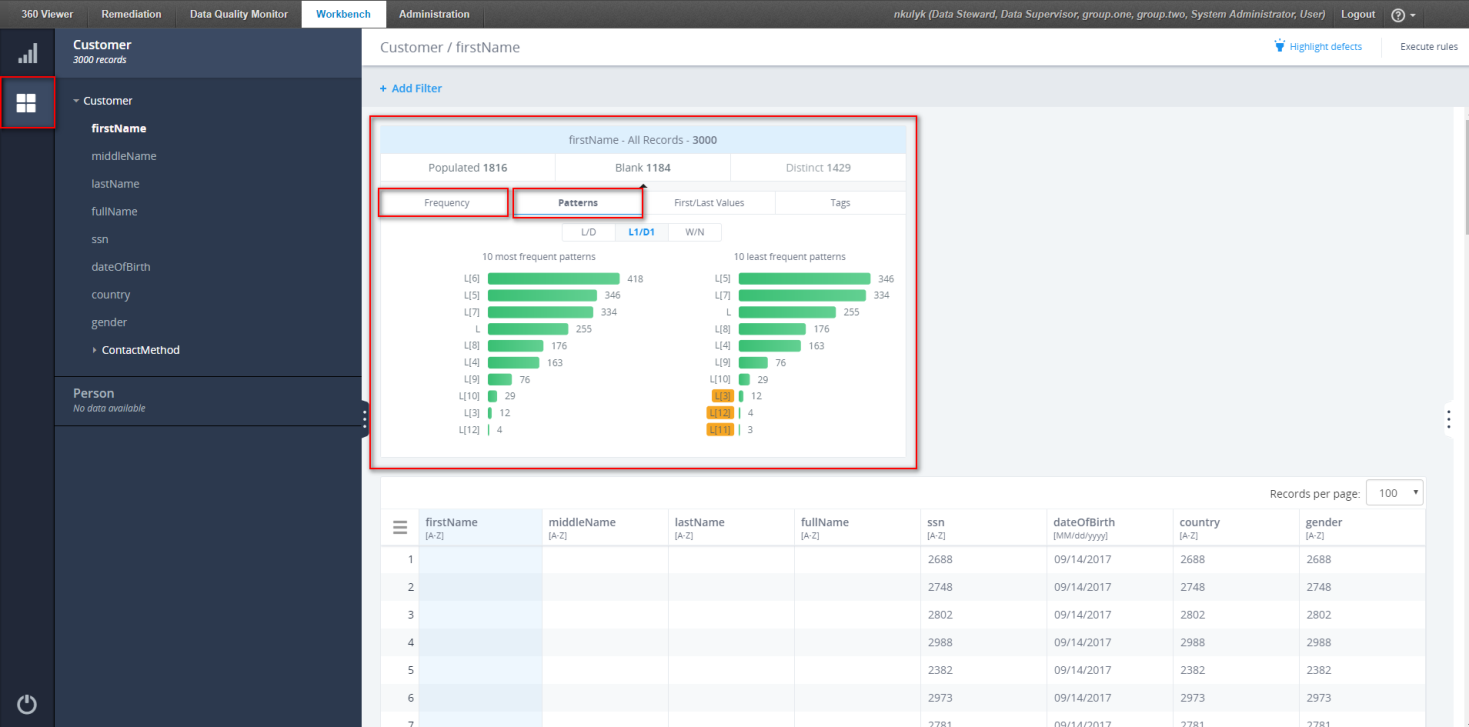
The following example shows highlighting for the 20 most/least frequent pattern charts for the firstName attribute.
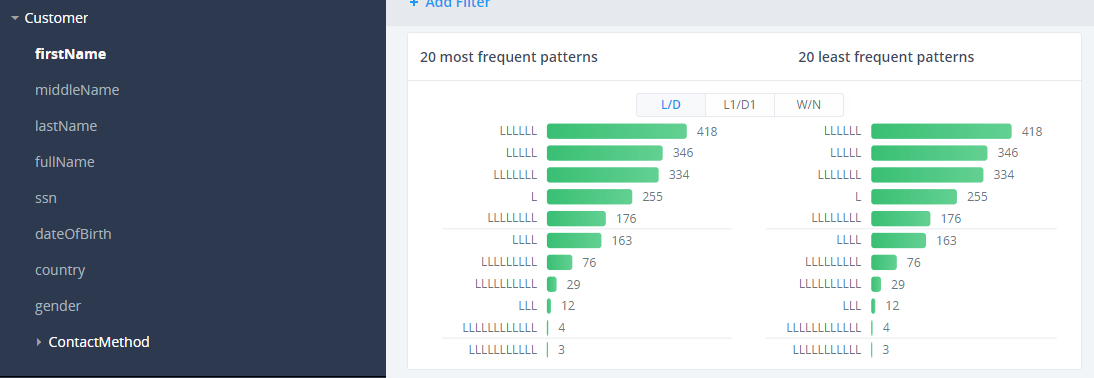
The following calculations are used to identify which values are highlighted:
TMP_TOTAL := pattern_total = sum(#records for all most frequent patterns)
TMP_TOTAL :=418+346+334+255+175+163+76+29+12+4+3=1815
TMP_DISTINCT := pattern_distinct = # of rows in most frequent patterns
TMP_DISTINCT := 11
20_THRESHOLD := TOTAL/5 = 1815/5 = 363 (static and doesn't change)
for each row from top 5 most frequent
do
if $records > 20_THRESHOLD
if 418 > 363 (true) do
TMP_TOTAL := 1815 – 418 = 1397;
TMP_DISTINCT := 11-1 = 10;
if 346 > 363 (false)
done
done
LOW_THRESHOLD := TMP_TOTAL/TMP_DISTINCT;
LOW_THRESHOLD := 1397/10 = 139.7;
for each row in least frequent
do
if $records < LOW_THRESHOLD/10
if 3 < 13.97 (true) do highlight done
if 4 < 13.97 (true) do highlight done
if 12 < 13.97 (true) do highlight done
if 29 < 13.97 (false)
done
done
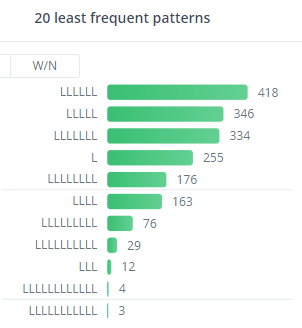
The following image shows the highlighted charts, containing values 3, 4, and 12.
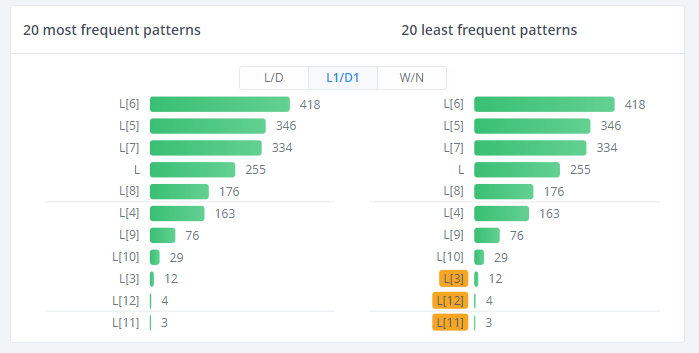
The same calculation can be performed to define highlighting for L1/D1 and W/N patterns.
Since the bar chart numbers of the L1/D1 patterns match bar charts numbers for L/D patterns, the result after highlighting defects will be the same.
Since the most and least frequent values for W/N patterns look different when defining which bar charts should be highlighted, new calculations should be performed.
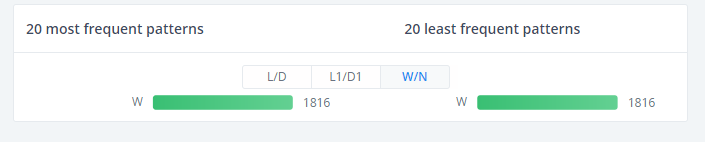
The following calculations are used to identify which values are highlighted:
TMP_TOTAL := pattern_total = 1816
TMP_DISTINCT := 1
20_THRESHOLD := 1816/5 = 363.2
for each row from top 5 most frequent
do
if 1816 > 363.2 (true)
TMP_TOTAL := 1816 - 1816 = 0;
TMP_DISTINCT := 1- 1 = 0;
done
done
The resulting output is that no bar charts are highlighted, as shown in the following image.
The following image shows a sample bar chart for the most and least frequent W/N patterns to view how highlighting will appear for the fullName attribute.
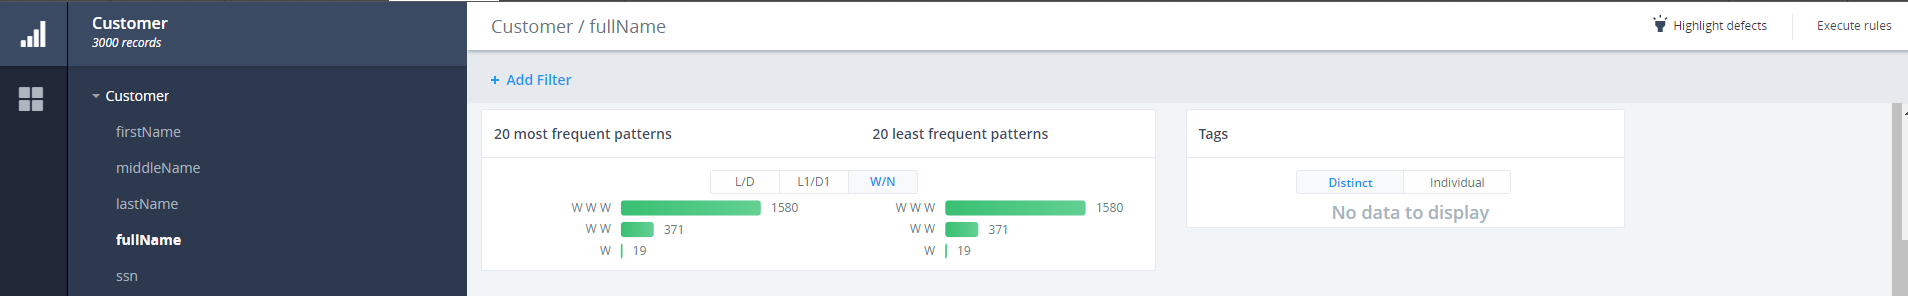
The following calculations are used to identify which values are highlighted:
TMP_TOTAL := pattern_total = 1580+371+19 = 1970
TMP_DISTINCT := 3
20_THRESHOLD := 1970/5 = 394
for each row from top 5 most frequent
do
if 1580 > 394 (true)
do
TMP_TOTAL := 1970-1580=390;
TMP_DISTINCT := 2
if 371>390 (false)
do
LOW_THRESHOLD := 390/2=195
for each row in least frequent
do
if 19<19.5 (true)
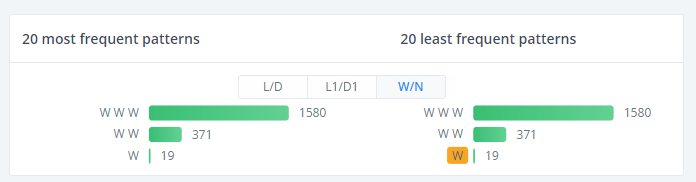
do
highlight
done
if 371<19.5 (false)
done
done
The resulting value for the highlighted bar chart is 19.
Highlight Defects in On-Screen Filters
The Highlight functionality can be also applied to On-screen filters on the Frequency and Patterns tabs.
The Rules that define which bar chart will be highlighted are the same as for the Profile page.