Using the Log Viewer
|
How to: |
The Log Viewer manages the display properties of system debugging information when the logging and tracing functions are activated. It filters and displays debugging information as each transaction is received and processed. The Log Viewer also displays the date/time range, type, source, and message of every trace entry.
Note: In order to display traces of a specific level, you must have previously enabled them to be written to the log file. For more information, see Log Settings and Trace Settings.
Procedure: How to Use the Log Viewer
- Click Tools in
the top pane and select Log Viewer from the
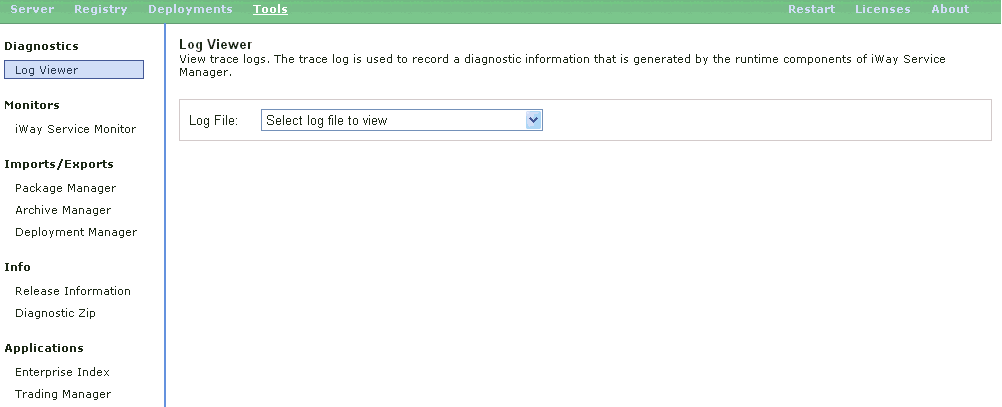
Diagnostics section in the left pane.
The Log Viewer pane opens, as shown in the following image.

- Select
a specific log file to view from the Log File drop-down list.
Note: Log file names are reused in a circular queue so that they will not proliferate and consume too much disk space. The date/time stamp is shown in the drop-down list in order to show the correct sequence of the files.
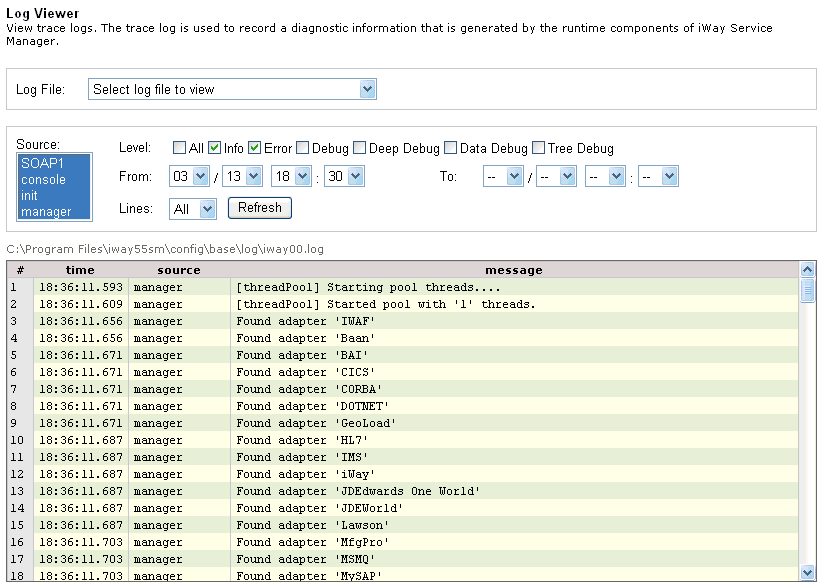
The Log Viewer pane is automatically refreshed and shows the log file you selected.

- Select
the source component, level, date/time range, and number of lines
to display and click Refresh.
The contents of the log file, as filtered by your criteria, are displayed.
Tip: Multiple trace sources can be selected by using Ctrl + click.