Performance Measuring Statistics
During the run, statistics with wall clock and CPU time are generated. On the summary page, all times are reported in second precision to four places. It is possible to develop a report for greater precision.
Wall clock times can in some cases show useful information. These times provide a measure of performance for a single message as experienced by the sender. They do not give any information regarding the throughput capacity of the server.
CPU and User times describe the actual execution time expended on messages. Implementation of these measurements is platform and JVM dependent. In many cases the CPU and User times are the same, as the JVM may not differentiate between the two. On those platforms in which the JVM does differ, the CPU time can be expected to be the greater of the two.
User time represents the CPU time that the current thread has executed in User mode, executing Server Manager Instructions.
CPU time is the sum of User time and System time, and includes the time spent setting up for JVM services such as locks, network operations, i/o operations, and so on.
Enter command:>stats
                In seconds
  name      count    low      high      mean      variance   std.dev.   ehr num/sec
mq1a  wall:      2   0.0470   0.1560    0.1015    0.0030    0.0545       -      9.85
      cpu :      2   0.0312   0.0625    0.0469    0.0002    0.0156       -
      user:      2   0.0312   0.0625    0.0469    0.0002    0.0156       -
The STATS command displays the statistics summary gathered to that point. To reset to zero, use STATS RESET. iWay recommends not trusting statistics until at least several messages have been handled to completion, as the server front-loads initialization. Once the system is in a steady state, you can reset the statistics to zero.
Users are cautioned that the numbers shown on the summary page are approximate and intended for general guidance only. Brief descriptions of the fields are provided in the following table. However, a complete understanding of the message processing distributions described by these figures requires some knowledge of statistics and probability as it applies to queueing.
|
Field |
Description |
|---|---|
|
count |
The number of messages handled for which statistics have been gathered. |
|
low |
The lowest time recorded for handling a message. |
|
high |
The highest time recorded for handling a message. |
|
mean |
The numeric mean of the times recorded. This is the sum of the times divided by the number of messages handled. This is also called the average. |
|
variance |
The statistical variance of the times recorded. Variance is a measure of how numbers disburse around the mean. |
|
std. dev. |
The statistical standard deviation of the times recorded. Standard deviation is a measure of how numbers disburse around the mean. |
|
ehr |
The Ehrlang Density Coefficient. This gives evidence of the randomness of the time distribution. If there are too few values to compute the coefficient, a dash ( - ) is displayed. If the coefficient is sufficiently close to constant, the term const is shown. This value is an approximation. A value of 1.0 indicates a Poisson distribution, which is the design point of the server. A very low value can indicate that the individual times recorded are wildly skewed and therefore less usable to predict behavior. |
|
num/sec |
The reciprocal of the mean giving the number of messages handled per second. This is shown for the wall time, and is not directly a measure of the throughput capacity of the server. |
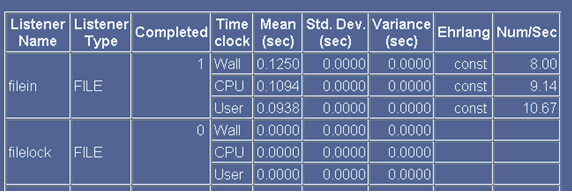
The iSM Administration Console can also display the summary of statistics. The monitor/statistics page provides a table to view this data, as shown in the following image.

Tips:
- When working with the complexity of a document (a number greater than -1 in the complexity field), a good rule of thumb is to use the number of digits in the field. For example, a message of 172 nodes would get a complexity measure of 3, while one of 1459 would get a measure of 4. For most purposes, this provides a reasonable value for analysis purposes.
- Traces consume time and memory in the server. For valid statistics, disable all trace. You can use the set command from the console to do this, or use the console configuration.
Additional Information:
For more information on queuing theory, the use of the available statistics, and the interpretation of the presented fields, many books are available.
Kushner, Harold J.; Heavy Traffic Analysis of Controlled Queueing and Communications Networks. New York, Springer; (June 8, 2001).