Debugger Concepts
|
Topics: |
This section presents the concepts required to adequately use the debugger.
Flow Development
A process flow is developed in iWay Integration Tools (iIT), and deployed to the iWay Service Manager (iSM).
Operating Modes
The debugger works in two modes, standalone unit testing mode, or server configuration testing mode.
- Unit Testing Mode. In this mode, the debugger starts the flow. The input document comes from the debugger and the output document is trapped by the debugger. This mode is ideal if the flow can be tested without the channel protocol.
- Configuration Testing Mode. In this mode, the server channels start the flows and provide the initial documents. The output documents are handled normally by the channel outlets. This mode makes it possible to debug an entire application (iIA).
Nodes and Edges
The flow consists of nodes connected by edges. Nodes are the units of execution in a flow.
The node name is specified in iIT. For more information regarding node names, see Syntax.
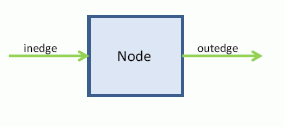
An edge coming into a node is called an inedge. An edge coming out of a node is called an outedge, as shown in the following example.

The same edge is both an outedge and an inedge for different nodes, as shown in the following example.

Source
The source name tells the debugger where to find the source code of the process flow. For process flows deployed under a channel, the format is:
<channelname>:[flowname]
If flowname is not specified, then the process flow from the default route is selected. Note that channelname may contain colons internally. For example:
file1:testflow
channel1:inlet.1:File.1:testflow
For system flows, the format is:
flowname
where flowname cannot contain a colon.
For a process flow stored in a file, the format is:
[:]filepath
Without the initial colon, the filepath cannot contain a colon and must not collide with the name of a system flow. When present, the initial colon forces the rest of the value to be interpreted as a file path, which may include colons.
To list all of the process flows that currently exist, use the following command:
shell show flows
The debugger reads the compiled version of the flow. Small differences in the shape of the flow may be visibly compared to iIT. This is due to the flow compilation.
Threads
A thread is a line of execution in a specific process flow. A thread may create other threads when execution splits into multiple edges, or when a subflow is called. All threads execute simultaneously, although some threads may be paused at a breakpoint.
The debugger is multi-threaded. It can control multiple threads within a flow and multiple independent flows simultaneously. While a thread runs, the debugger remains responsive to commands since it runs asynchronously with the flow.
The name of a thread has the format W.channelname.workernumber.flowname[.split] , where split can be absent. For example, the name of a thread running the flow testflow in channel file1 with worker 3 might be W.file1.3.flowtest. In unit testing mode, the channel name is debugger, therefore the name of the thread would be W.debugger.3.flowtest.
For simplification, the debugger assigns a thread ID to each thread. The format is tNNNN , where NNNN is a unique monotonically increasing number. When printing the name of a thread, the debugger always precedes it with the ID.
For example, t5: W.file1.3.flowtest. In this example, the thread W.file1.3.flowtest has the id t5. The colon is a separator. It is not part of the ID.
In the command language, when a thread is specified, the thread name, or the ID, can be used interchangeably.
A thread terminates normally when it reaches an end node, or abnormally when it cannot handle an error condition. A process flow terminates when all its threads terminate. Therefore, before the original thread in the flow terminates, it must wait for all its child threads to terminate. The original thread is said to be in the waiting state when it has finished execution, but some child thread is still running.
The following table lists all the thread states:
|
State |
Description |
|---|---|
|
running |
Continuous execution. |
|
waiting |
Flow ended, waiting for child flows to end. |
|
stepping |
Executing a single node, skipping over subflows. |
|
stepping_into |
Executing a single node, entering into subflows. |
|
stepping_nearest |
Executing half a node, processing stage only, or dispatch stage only. |
|
pausing |
Suspended waiting for debugger command. |
|
ending |
Stopping execution per user's request. |
Breakpoints and Watchpoints
A breakpoint is an instruction to stop the execution of the flow at a specific location under some conditions.
A watchpoint is an instruction to stop the execution of the flow at any location when an event that satisfies some condition is detected.
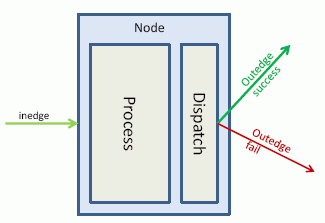
Within a node, the execution is divided into two stages:
- The node is processed. This returns a document and a list of edges.
- The document is dispatched on the matching wired outedges. One outedge continues execution on the same thread. If multiple edges match, each remaining outedge forks a new thread.

When none of the returned edges can be followed, dispatch will create a synthetic edge and attempt to match it. For example, it may attempt to match OnDefault, OnCompletion or OnFailure. If that still does not match, it will attempt OnError. If OnError is not followed and the error is not caught, the flow terminates abnormally.
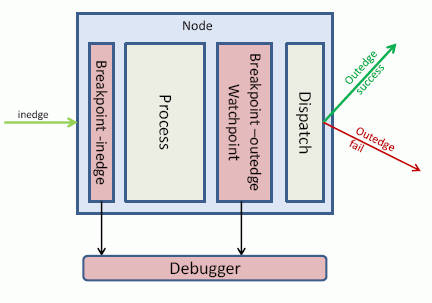
The debugger supports two kinds of breakpoints depending on the stage where it stops within the node execution.
- An inedge breakpoint. Stops before the processing stage and therefore before the node executes. This is similar to a Java debugger that stops on a line before that line executes.
- An outedge breakpoint. Stops after the node processing but before the dispatch stage. There is no equivalent in a Java debugger.
A watchpoint behaves like an outedge breakpoint because it also stops before the dispatch stage. Logically, this identifies the node that satisfied the condition. This is more convenient than stopping at the start of the next node because there could be many nodes due to multiple outedges matching.
The following image depicts the inedge and outedge stages of the debugger:

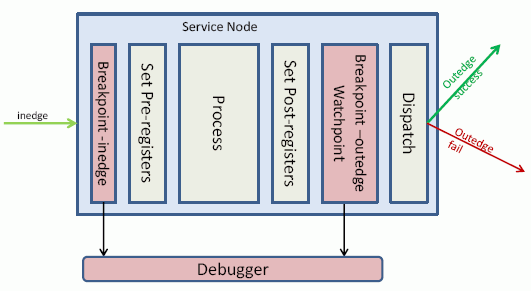
For a service node, an inedge breakpoint occurs before the assignment of the pre-registers. Conversely, an outedge breakpoint occurs after the assignment of the post-registers.

It is possible to define one inedge breakpoint and/or one outedge breakpoint on a node, for a maximum of one at each location. If a duplicate breakpoint is defined at the same location but different conditions,it will overwrite the one previously configured.
Watchpoints are not tied to specific nodes. Nevertheless, if a duplicate watchpoint is defined for the same event but different conditions, it will overwrite the one previously configured for this event.
While paused on an inedge breakpoint, commands are available to inspect and modify: the inedge, the registers and the input document. The inedge is usually immaterial to the execution of the node except for iterator nodes.
While paused on an outedge breakpoint, possibly due to a watchpoint, commands are available to inspect and modify: the returned list of edges, the registers and the output document. The comma-separated list of edges has a significant impact on the flow execution as it will influence the result of the following dispatch stage.
The debugger assigns a unique breakpoint ID to each breakpoint. The format is bNNNN where NNNN is a monotonically increasing number. Watchpoints are also assigned a unique watchpoint id with the format wNNNN.
Current Location
The debugger keeps track of the current source, the current node, and the current thread. The current node is always within the current source, but the current source and the current thread may be unrelated. For example, it is possible to set the current source to a subflow, before calling it from the current thread.
In general, the commands take their default arguments from the current location. Therefore, the current location is the default source, default node and the default thread.
The user can set the current location explicitly. The debugger also maintains the location intuitively.
Special Registers
A special register holds a value. It is the equivalent of a variable for the flow. A register is defined in a scope. Scopes form a hierarchy from the most specific (at the thread level) to the most general (at the server level). A register is inherited from a higher scope unless it is redeclared at an inner scope. The inner scope register shadows the outer scope register, but both continue to exist. It is possible to access the outer scope register by specifying the correct scope. This is useful to share a value between threads, or to return a value to a higher scope before the current scope ends.
|
Scope |
Aliases |
Description |
|---|---|---|
|
local |
thread |
Most local scope for the current thread line. |
|
flow |
Registers available throughout the flow. |
|
|
message |
global, system, worker |
Registers available following completion of the flow. |
|
channel |
master |
Registers available to all workers in the channel. |
|
session |
Registers saved in the session. For example: cookies. |
|
|
server |
manager |
Registers available to all channels in the configuration. |